Object detection is an extremely common use case of deep learning in computer vision. Its main task is to put accurate bounding boxes around all the objects of interest in an image and correctly label such objects. While this sounds simple enough as a high-level explanation, when we actually get to implementing an object detector, it is not immediately obvious how we should go about evaluating our model's performance. After all, the concept of correctness isn't as clear-cut here as in the case of, say, classification. This is where measures like Intersection over Union and mean Average Precision (mAP) come in. These concepts may sound intimidating (especially since mean and average are the same things, which can cause confusion), but they are quite simple when broken down. This blog post will focus on mean Average Precision, addressing the following:
- Mean Average Precision: What it is and how it works
- Confusion matrix
- Precision and Recall: The metrics mAP is based on
- Precision recall curve
- Intersection over union (IoU)
- Average precision (AP)
- Calculating mAP from average precision
- Evaluating object detectors: So, what's a good mAP score?
- Bonus: Why mAP can't be used directly
What is Mean Average Precision (mAP)
Mean average precision (mAP) is a metric for evaluating object detection models performance. It is one of the key evaluation metrics alongside other measurements like precision and recall that gives a comprehensive description of how well the model detects various objects. Widely adopted in computer vision applications, mAP measures the agreement between the model's predicted bounding boxes and the ground truth annotations, With the correct understanding of mAP, you'll be able to analyze and interpret model performances across different areas like autonomous driving, surveillance, medical imaging, etc.
How to evaluate an object detection model?
Before getting into the nitty-gritty in a moment, let's develop an intuition for how we would evaluate an object detector. To do this, we must understand what exactly we want our model to do and what we want it not to do. Well, for starters, we would like our model to be able to detect all the objects of interest present in an image, or at least as many as possible. We would also want the drawn-by model to be as accurate as possible, enveloping the object fully but not including much else. We'd like our model to assign class labels to each object correctly (i.e. both detect the cat and say that it's a cat). Finally, we wouldn't want our model to “see” objects where there are none.
Now that we have a pretty good idea of what we want our model to do let's see how mean average precision (mAP) works and how it helps us in object detection tasks based on the above-mentioned criteria.
Confusion matrix
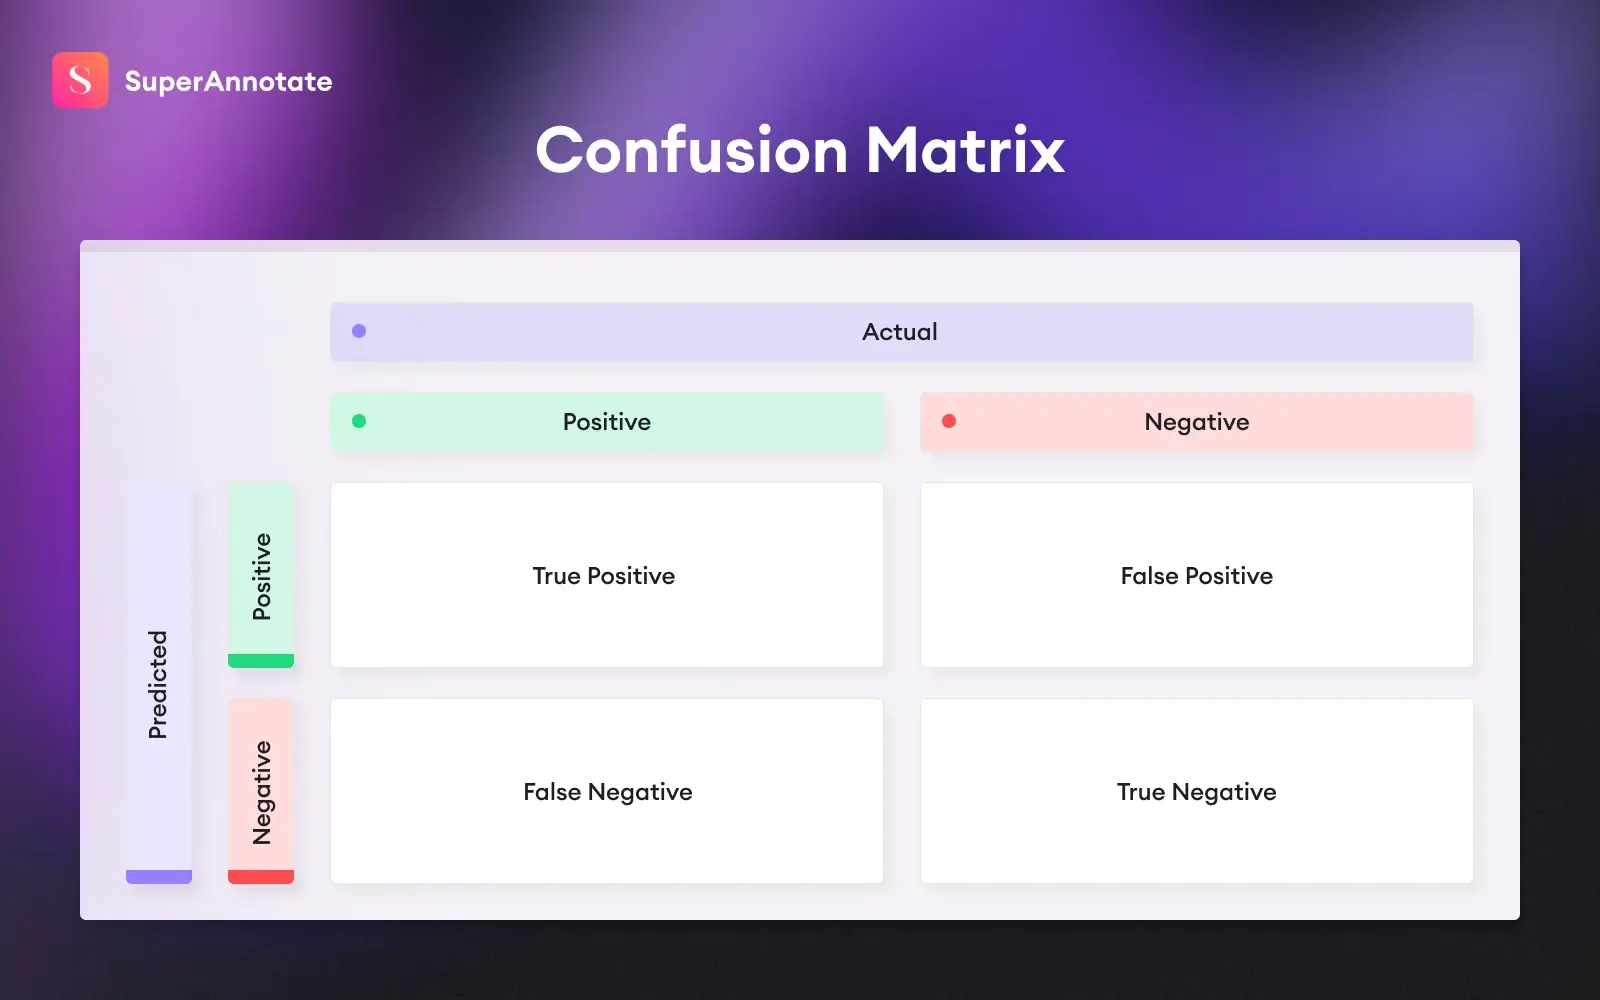
To understand mean Average Precision, one first needs to comprehend the concepts of precision and recall, which in turn requires an understanding of true/false positives and false negatives (the concept of true negatives doesn't really have a meaningful usage in object detection).
In the case of object detection, it can be interpreted as follows:
- True positive: the model has identified the correct type of object in the correct location
- False positive: the model has identified an object that isn't there or has assigned a wrong label
- False negative: the model hasn't identified an object that it should have
Once our model makes predictions, we go over each of the predictions and assign it one of the above-mentioned labels. Based on this, we can calculate precision and recall.
Precision and recall: The metrics mAP is based on
Precision and recall measures are model evaluation metrics that describe how well the model is performing in terms of correct predictions and capturing relevant instances.
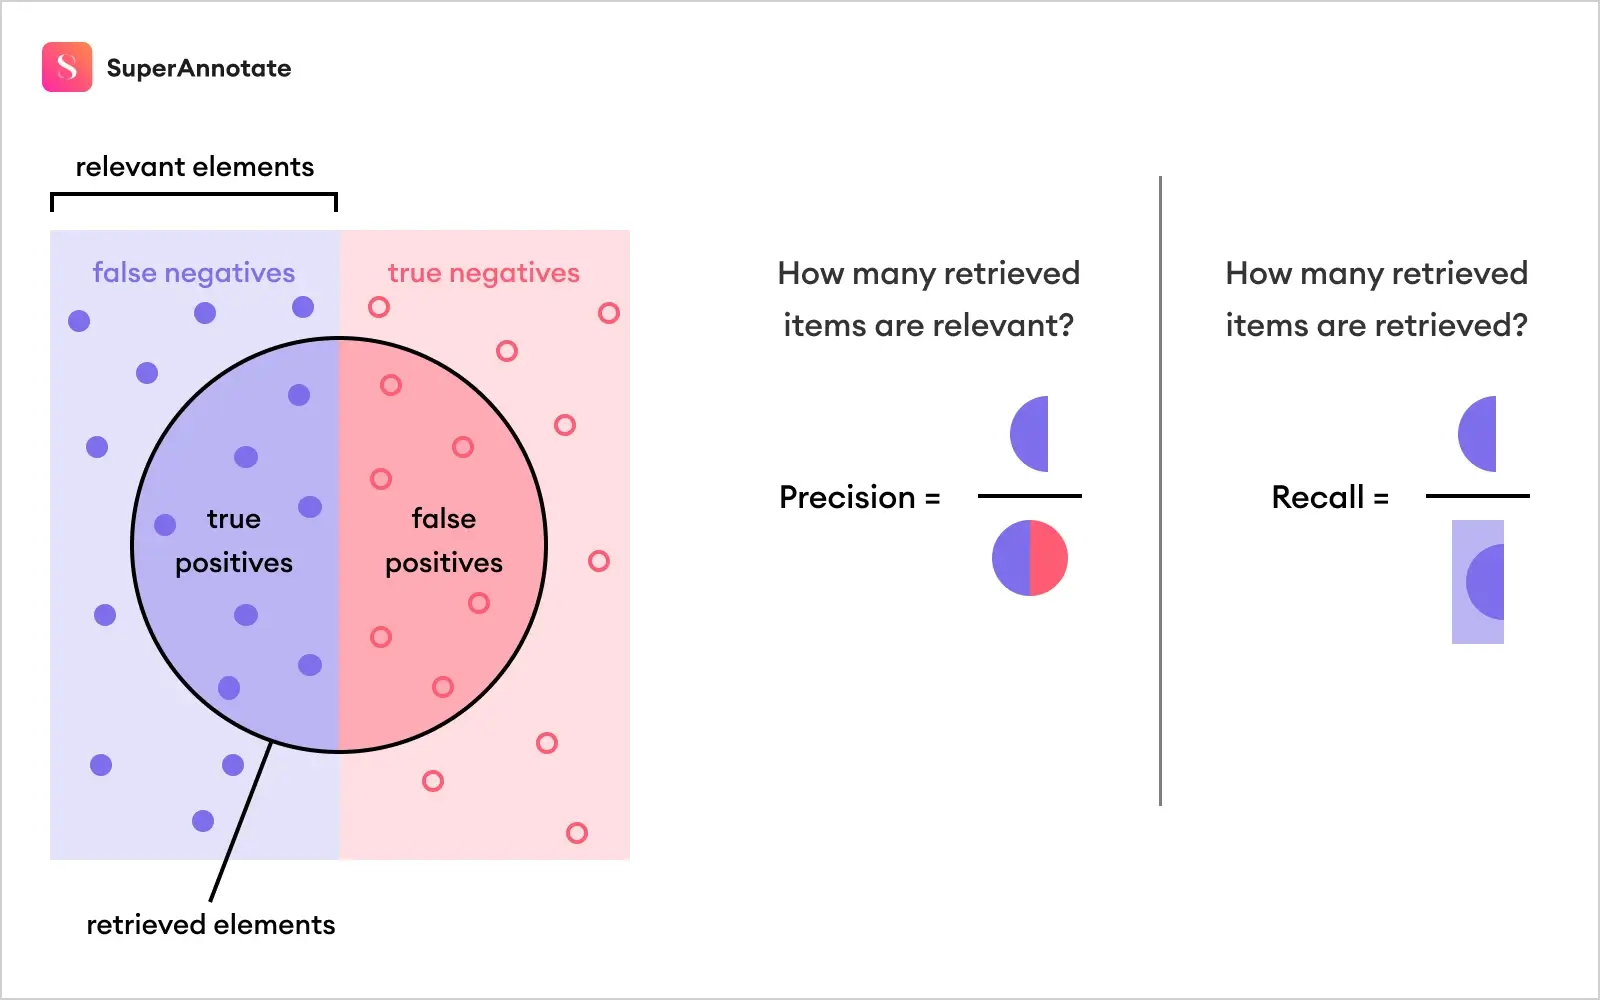
Precision = True positives / (True positives + False positives)
Recall = True positives / (True positives + False negatives)
While the formulas may at first seem random, they're quite intuitive. Simply put, precision and recall answer the following questions:
- Precision: out of all the predictions the model has made for a given class, how many are correct (expressed as a fraction)?
- Recall: out of all the examples of a given class in the data, how many has the model found (again expressed as a fraction)?
Imagine you are a security analyst responsible for monitoring surveillance camera footage to identify potential intruders in a restricted area. You have an object detection model that detects and classifies objects captured by the cameras.
Your precision values will tell you how precise or accurate your model is; in this case, what's the proportion of people that the model correctly identified as having the intruders(TP) out of all the people who were predicted as being intruders (TP + FP)? High precision means that when the model predicts that the person is an intruder, it is likely to be correct. For example, if the model predicts that 90 out of 100 people are intruders(TP + FN) and 85 of them actually are (TP), the precision would be 85/90 = 0.9444 (94.44%). This indicates that the model's predictions are accurate most of the time.
The recall describes how "thorough" your model is. It tells you out of everyone who actually are intruders, and which proportion you managed to correctly identify. Let's say there are 100 intruders (TP+FN), and your model succeeded to predict 75 of them (TP), your recall will be 75/100 = 0.75 (75%). This means that your model is correctly predicting 75% of actual positive cases.
Think of it this way: precision focuses on the correctness of the model; recall focuses on the comprehensiveness of the model.
The choice between prioritizing precision or recall depends on the specific goals and requirements of the task at hand.
Prioritizing precision means focusing on minimizing false positive instances. False positives occur when the model incorrectly predicts the presence of an object that is not actually there.
Prioritizing recall means focusing on minimizing false negatives. False negatives occur when the model fails to detect or miss actual objects present in the scene.
For example, in a security system, you may prioritize precision to minimize false alarms and focus on high-confidence detections. On the other hand, in a medical screening scenario, you may prioritize recall metrics to ensure that potential abnormalities are not missed, even at the cost of some false positive values. Understanding the context, potential consequences of FPs and Fns, and the desired outcome will guide the decision-making process to strike the appropriate balance between precision and recall.
This tradeoff between precision and recall is addressed through precision recall curve.
In object detection, precision recall concept in its turn coexists with intersection over union, and the combination of these two is utilized to describe object detection model performance.
Precision recall curve
The precision recall curve is a handy plot to showcase the relationship and tradeoff between precision recall values as we adjust the decision threshold of the classifier. Here's what a precision recall curve looks like:
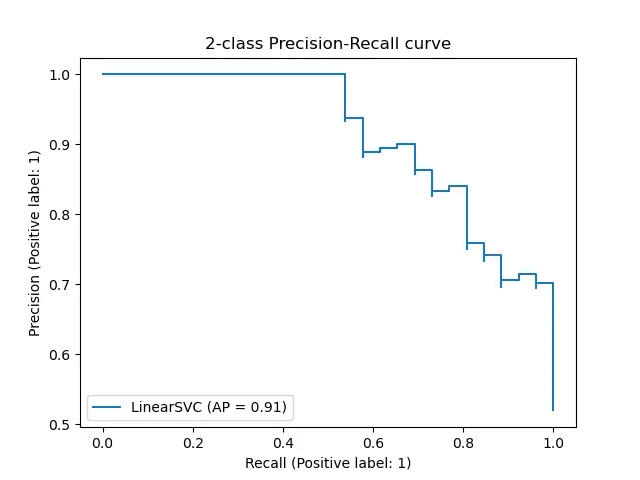
The precision recall curve helps us analyze and assess the model's performance for different thresholds or decision boundaries. The shape of the precision recall curve matters and just by looking at it, you'll gain valuable insights into the classifier's performance. A curve that hugs the top-right corner indicates excellent performance, where high precision and high recall are achieved simultaneously.
On the other hand, a curve that bows downwards suggests a trade-off between precision and recall, where increasing one metric lead to a decrease in the other.
To assess the overall performance of a classifier, we can summarize the precision recall curve using the area under the curve (AUC-PR). A higher AUC-PR value signifies better performance, with a maximum value of 1 indicating perfect precision and recall trade-off.
Intersection over union (IoU)
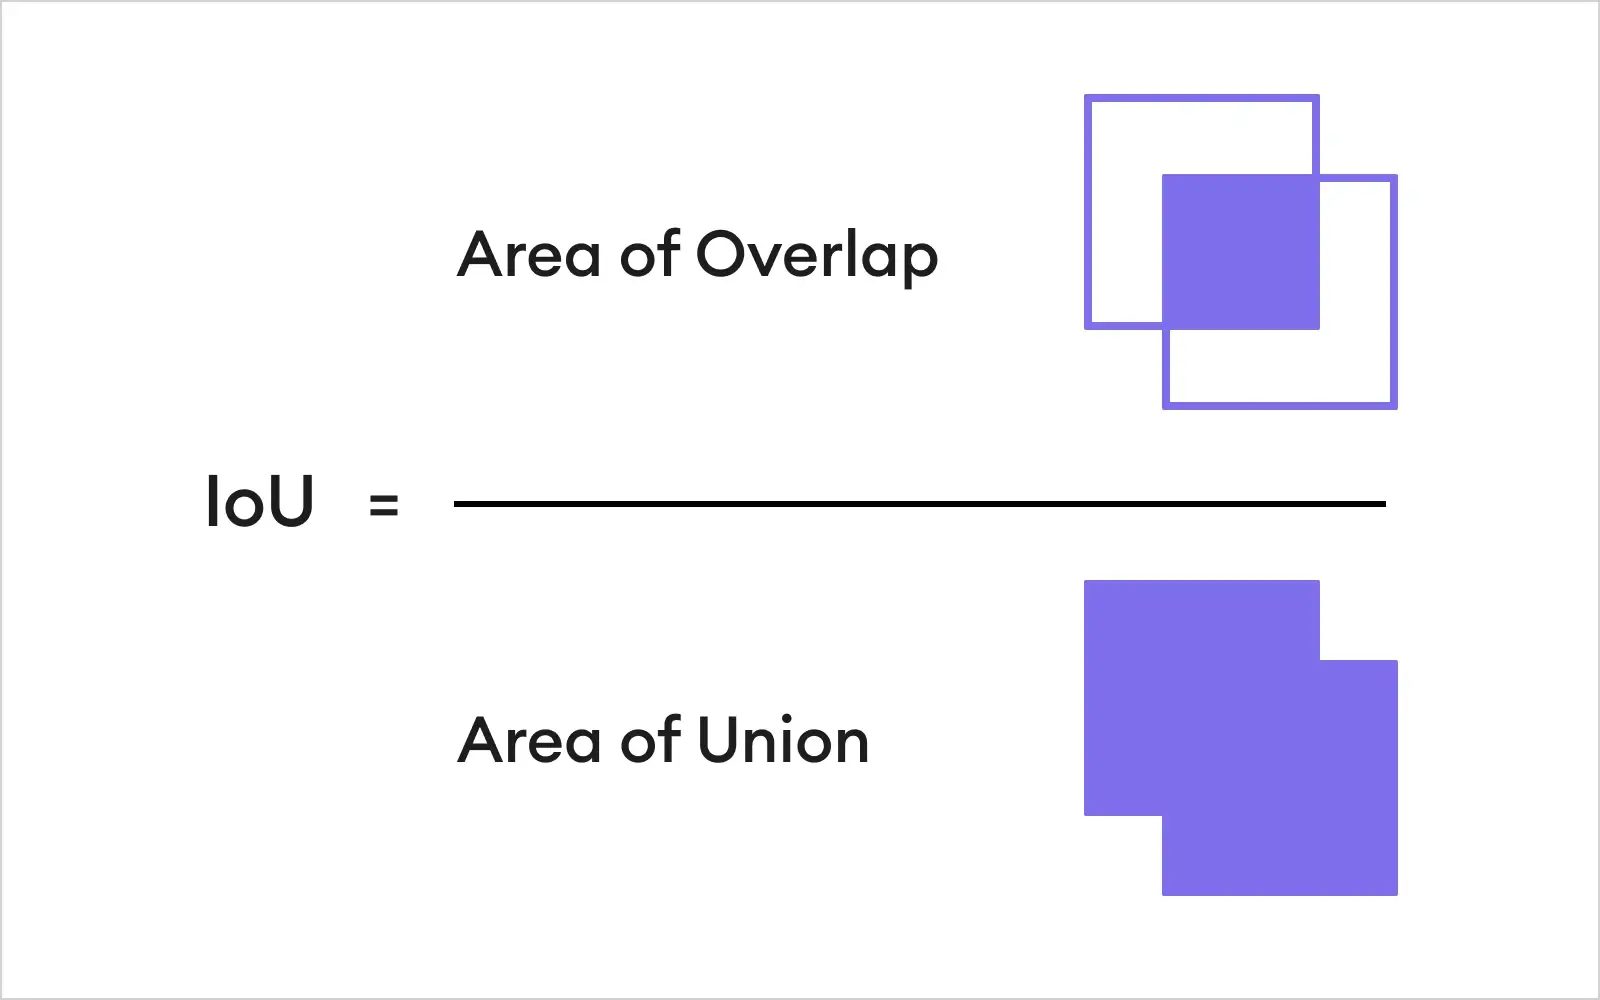
Intersection over union is simply a measure that shows how well the predicted bounding box aligns with the ground truth bounding box. Let's break down the term; "intersection" is the overlapping part of the predicted region and the initially labeled region, and "union" is the combined area of both predicted and ground truth bounding boxes.
Intersection over union formula is simply the division of these two:
IoU = Area of intersection / Area of union
IoU is expressed as a percentage or decimal number and explains how well our algorithm is performing. Higher IoU indicates better alignment between predicted and ground truth bounding boxes, and more accurate detection. In real-life scenarios, we'll rarely have an exact match, and that's not even the goal. The objective is to make sure our predicted bounding boxes lie as close as possible to the real region of interest.
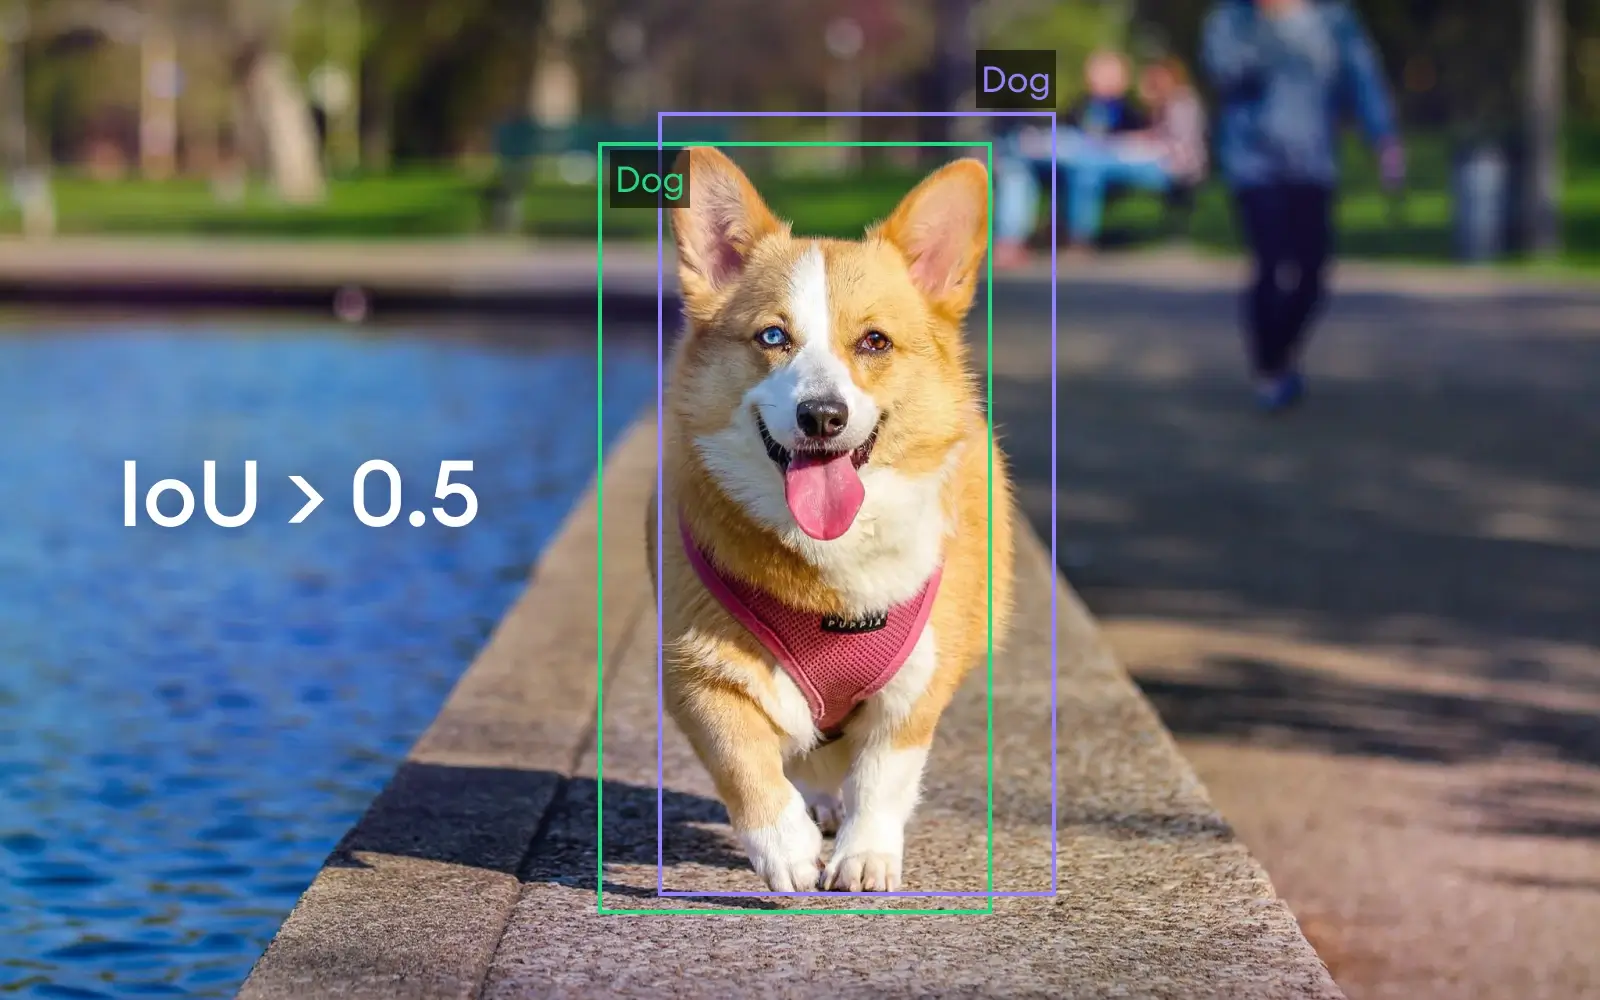
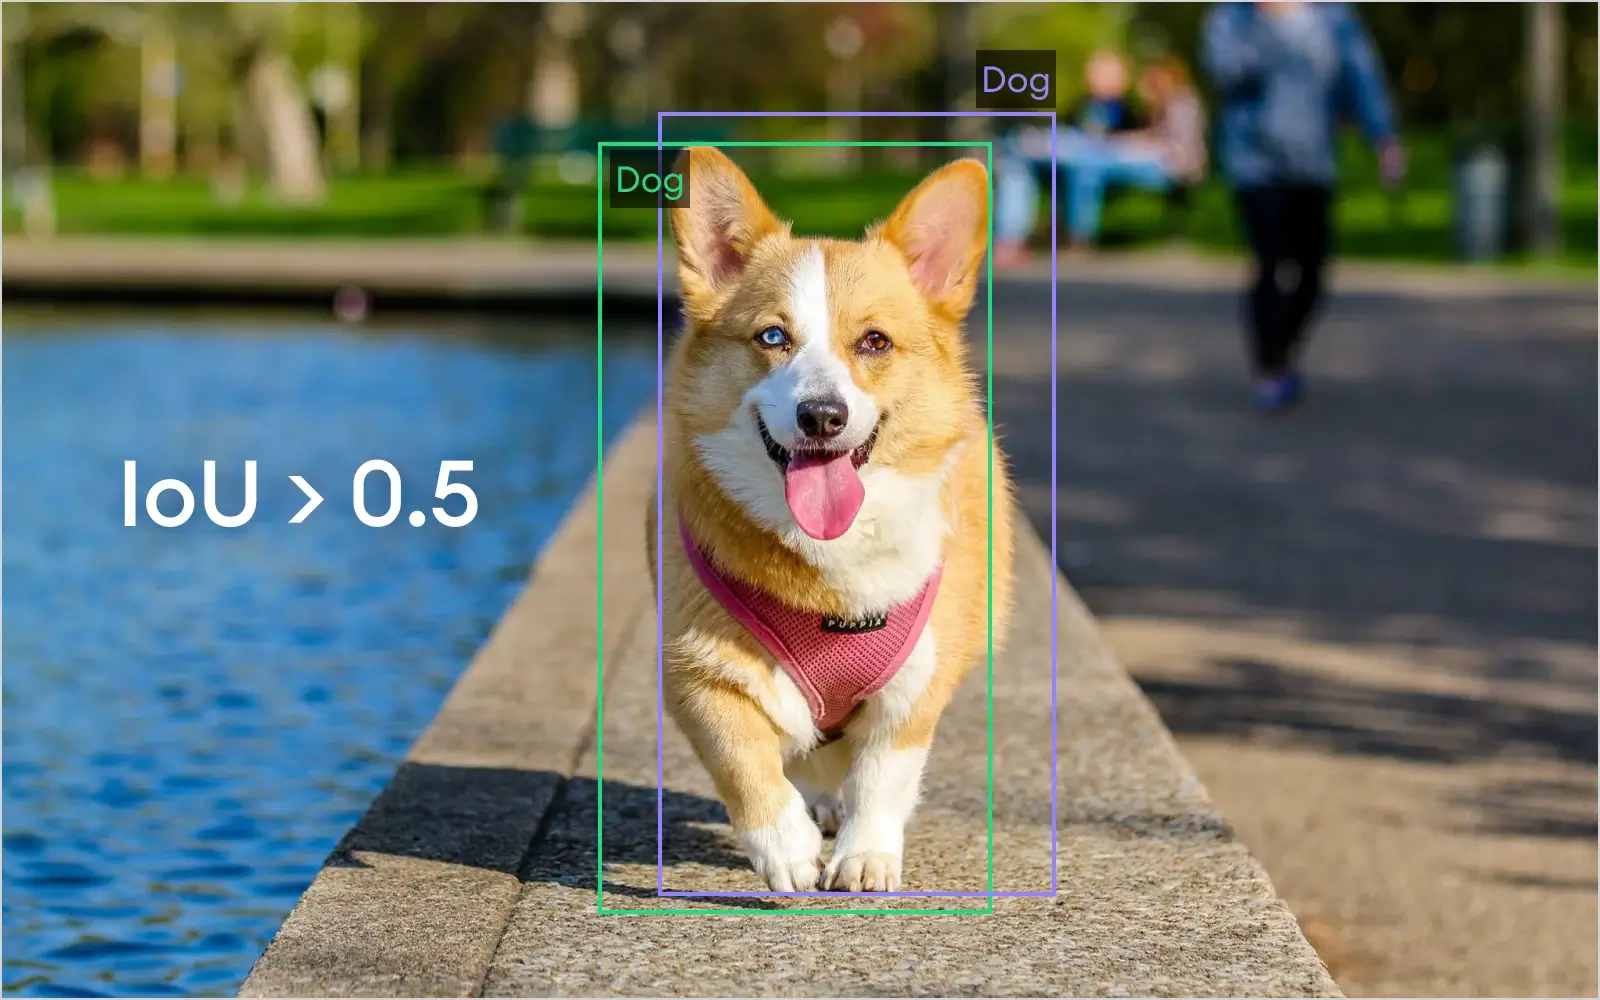
Let's mix IoU with what we learned before and see how they work incorporated (*warning! dangerous dog; you may be bitten by its cuteness).
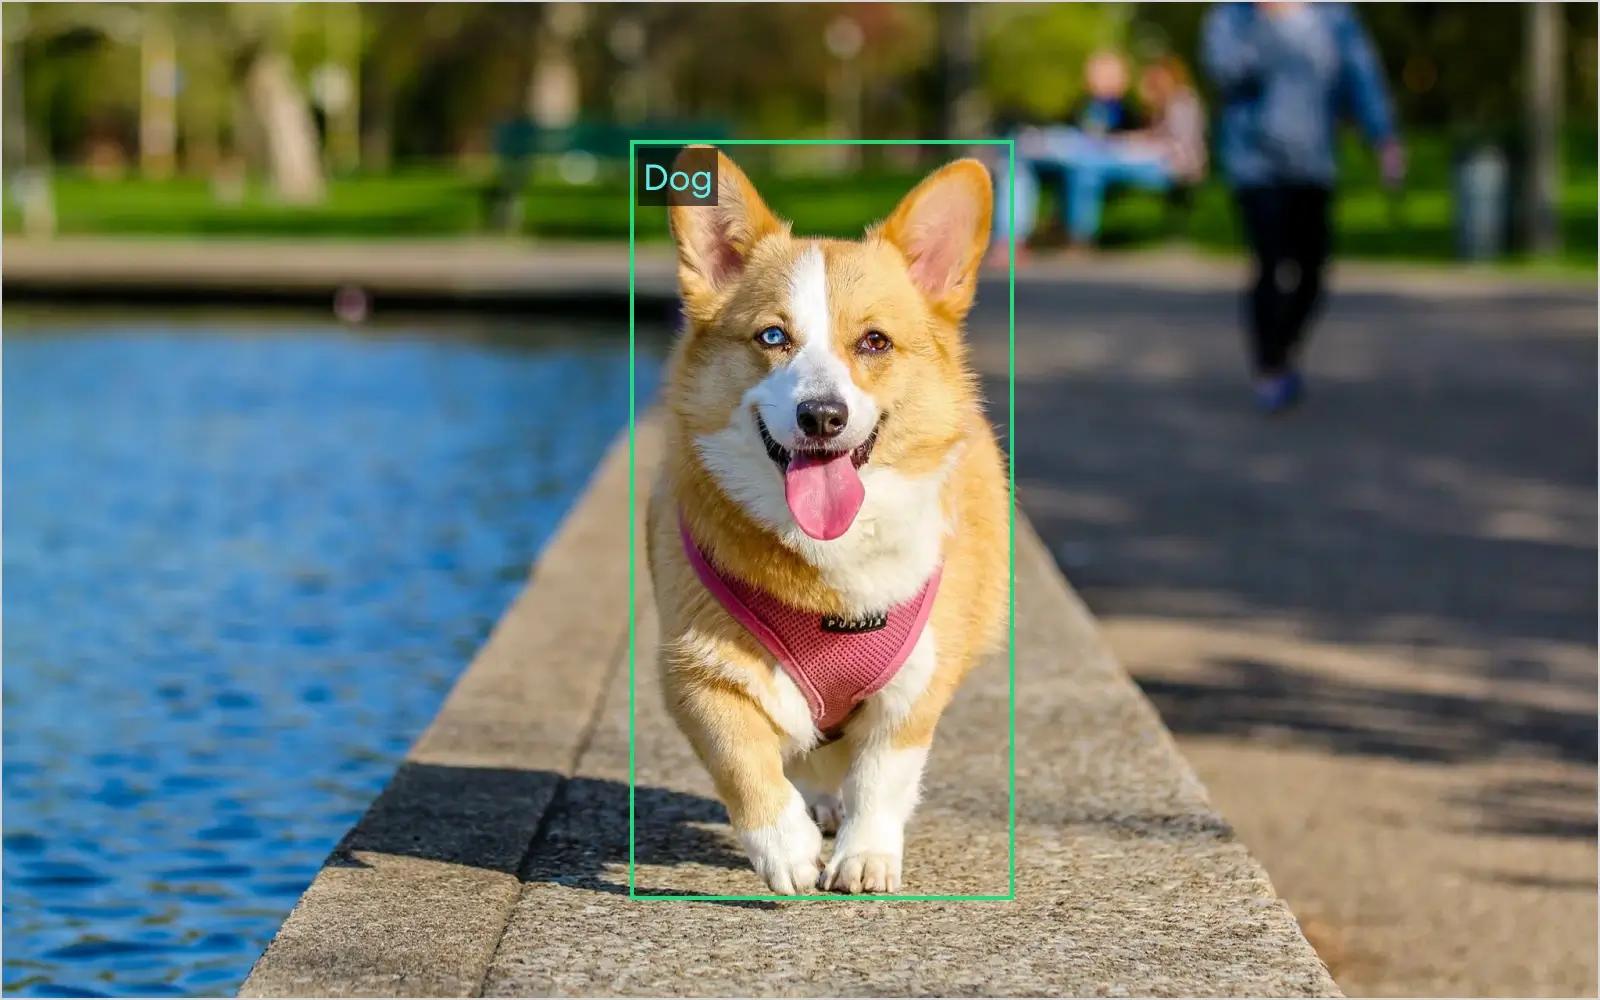
In the picture, you can see the ground truth bounding box that indicates the exact position of the dog. We'll now discuss true positive, false positive, and false negative cases along with IoU scores (purple boxes indicate the predicted BB).
1. True Positive
When the Intersection over union (IoU) value is bigger than 0.5, we describe it as a true positive case. This means the predicted bounding box is aligned with the ground truth bounding box enough to be considered as a correctly identified value.
2. False Positives
In case IoU is < 0.5, meaning the predicted BB does not have a proper match or is completely outside of the true BB, we identify the case as False Positive.
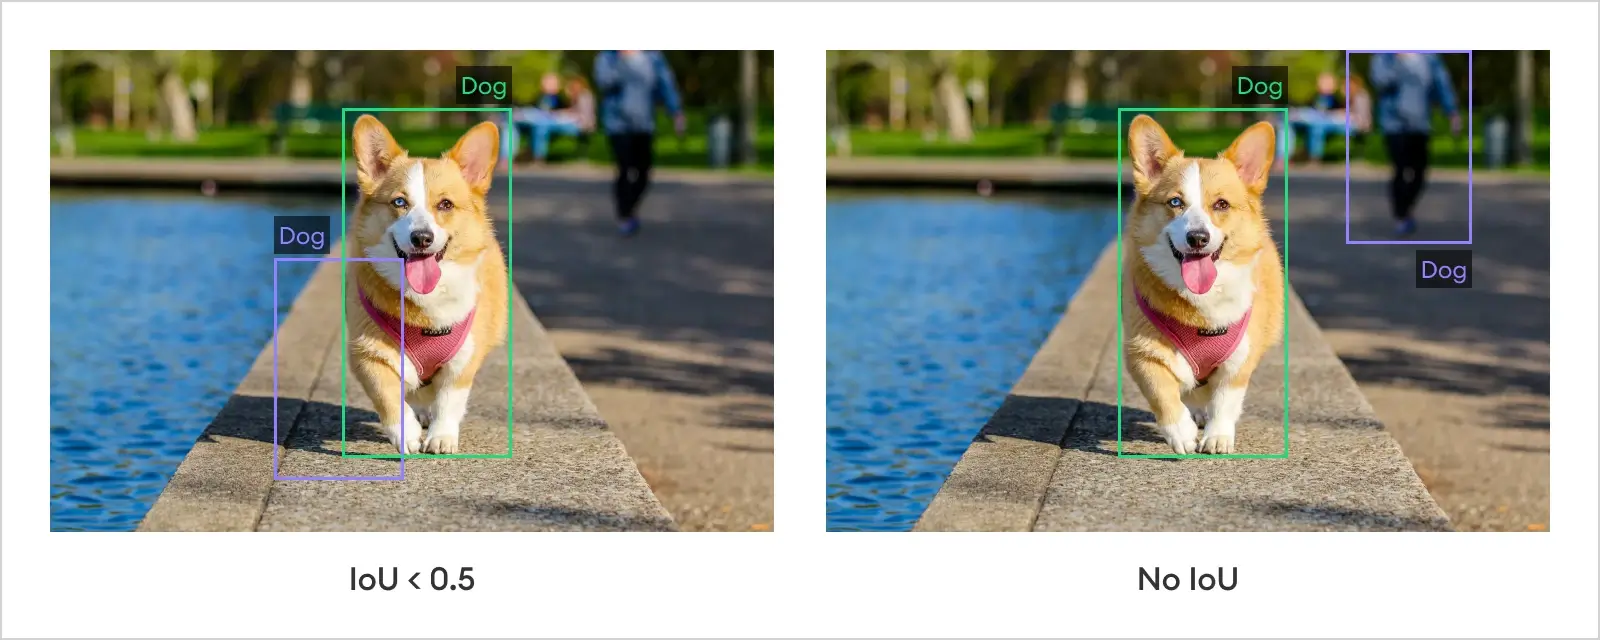
3. False Negative
Maybe our object detection algorithm failed to identify the correct animal and predicted it to be a cat, or did not find the object at all. This means that we have a falsely identified negative value.

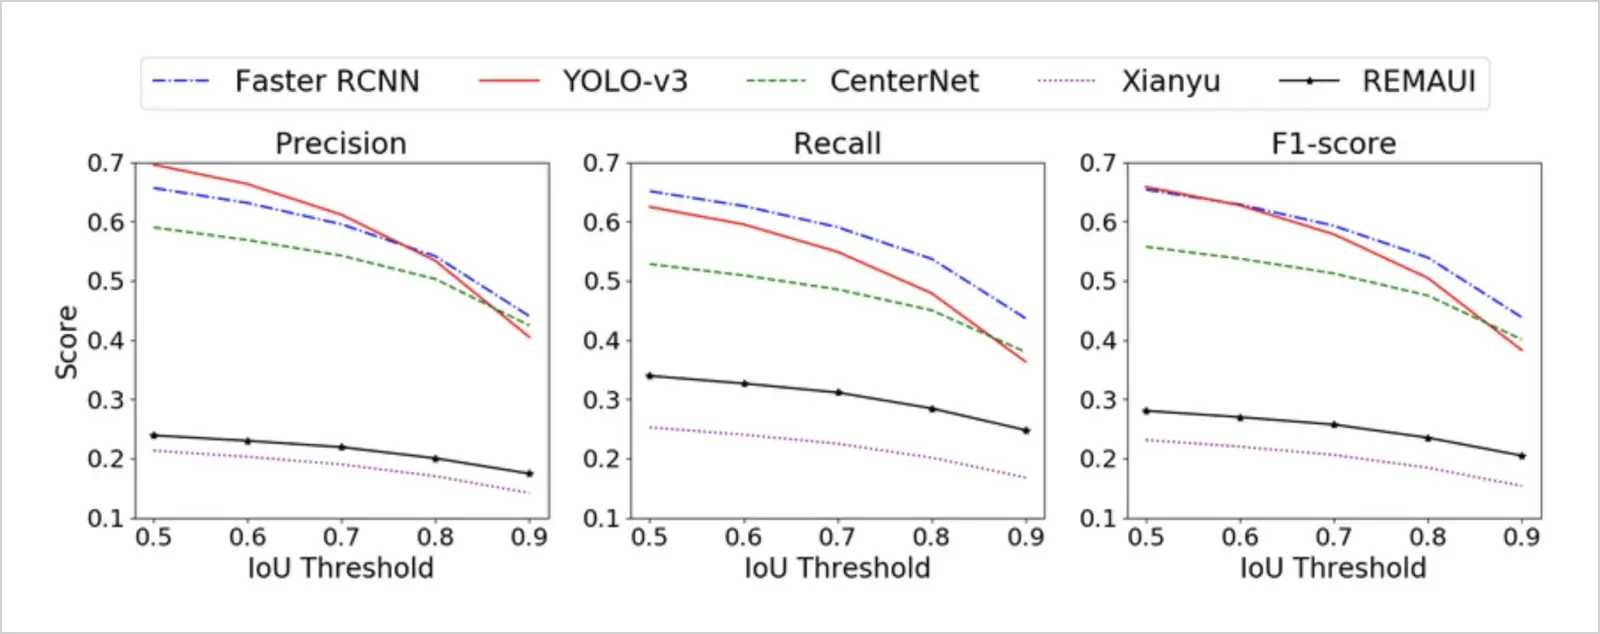
Given the object detection example at hand, one needs to choose a fitting IoU threshold. IoU threshold refers to the minimum IoU value required for a predicted region to be considered as a correct detection -- in other words, have sufficient overlap with the ground truth object. Logically, IoU threshold choice will affect our known performance measures, which we should not overlook while evaluating object detection models. Let us see how and why.
You're seeing precision, recall, and F1 (also a performance measure) metrics on the Y axis and IoU threshold on the X axis for different object detection models. Notice that as the threshold increases, the behavior of the metrics changes; we primarily notice a decrease for each evaluation metric (think of why this is the case).
Average precision
Remember the AUC from precision recall curve? Average precision is generally the area under the curve value, which represents the AP achieved across all recall levels. It is obtained through numerical integration techniques, like a trapezoidal rule or interpolation methods (the most famous being 11-point interpolation)
- The trapezoidal rule approximates the area between consecutive points on the Precision-Recall curve as a trapezoid, and the sum of these areas gives the AP value.
- In the 11-point interpolation method, precision values are computed at 11 specific recall levels (0.0, 0.1, 0.2, ..., 1.0), and the AP is calculated as the mean of these interpolated precision values.
Interpolated precision
The intersection of union and mAP concepts is usually used together in practice. Let us see how one follows another.
Imagine we have image data of a dog and we're interested in detecting dogs with IoU scores higher than 0.5; we will require our predicted bounding box coordinates to have at least 0.5 intersections over the union score with the ground truth boxes. Our model made 3 true positives and 4 false positive detections. Let's break down the process and see how average precision AP is calculated.
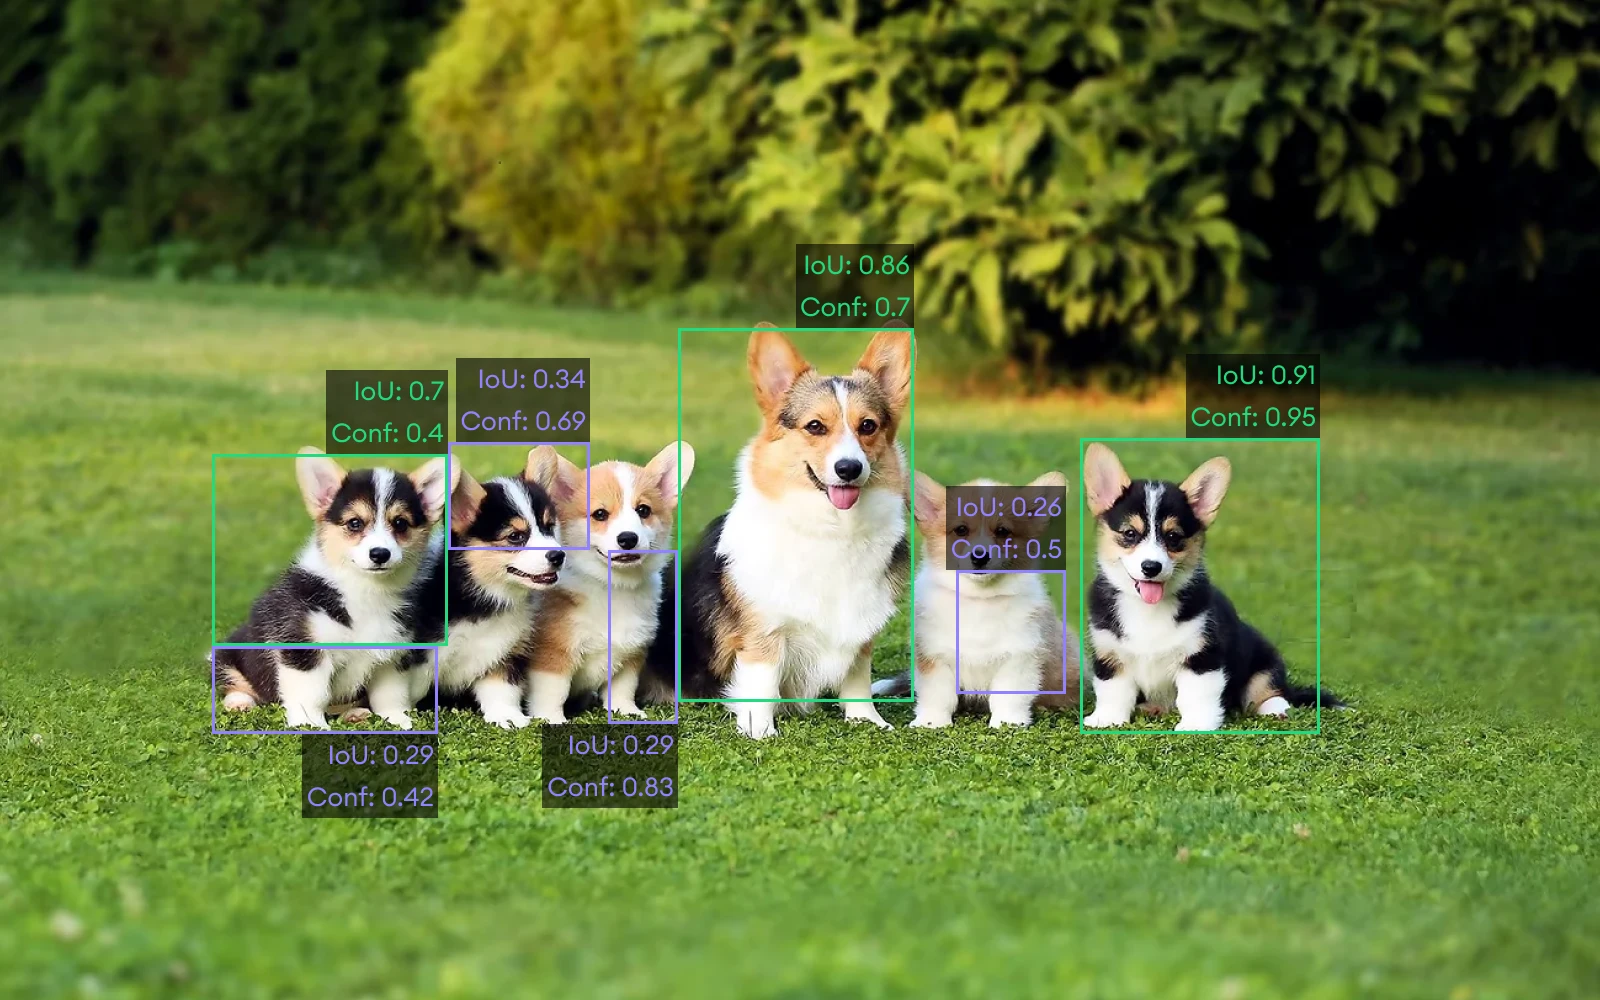
In the image, you can see the green boxes (True Positives), where the model managed to make correct predictions of dogs with IoU scores higher than 0.5. In the case of the purple boxes, the IoU score is less than 0.5 and there are 4 such cases (False Positives). The confidence scores will help us rank the detections in order to calculate precision, recall, and average precision later on.
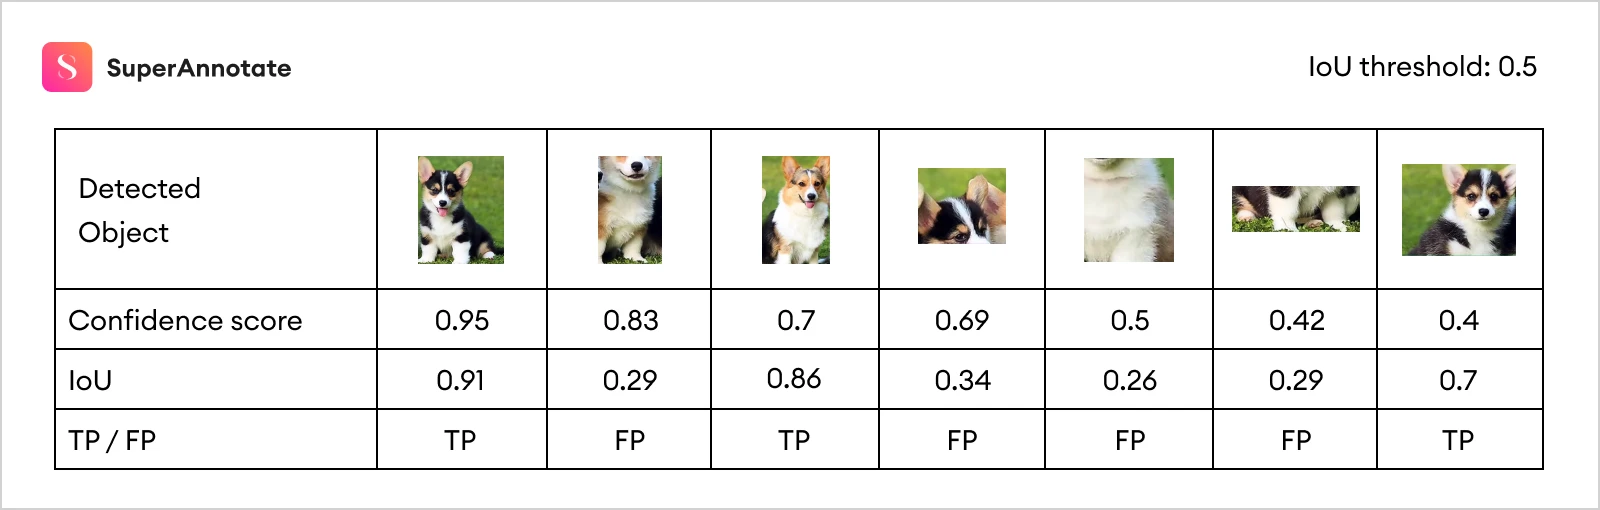
Let's now put the precision and recall concepts together and see how average precision (AP) is calculated.
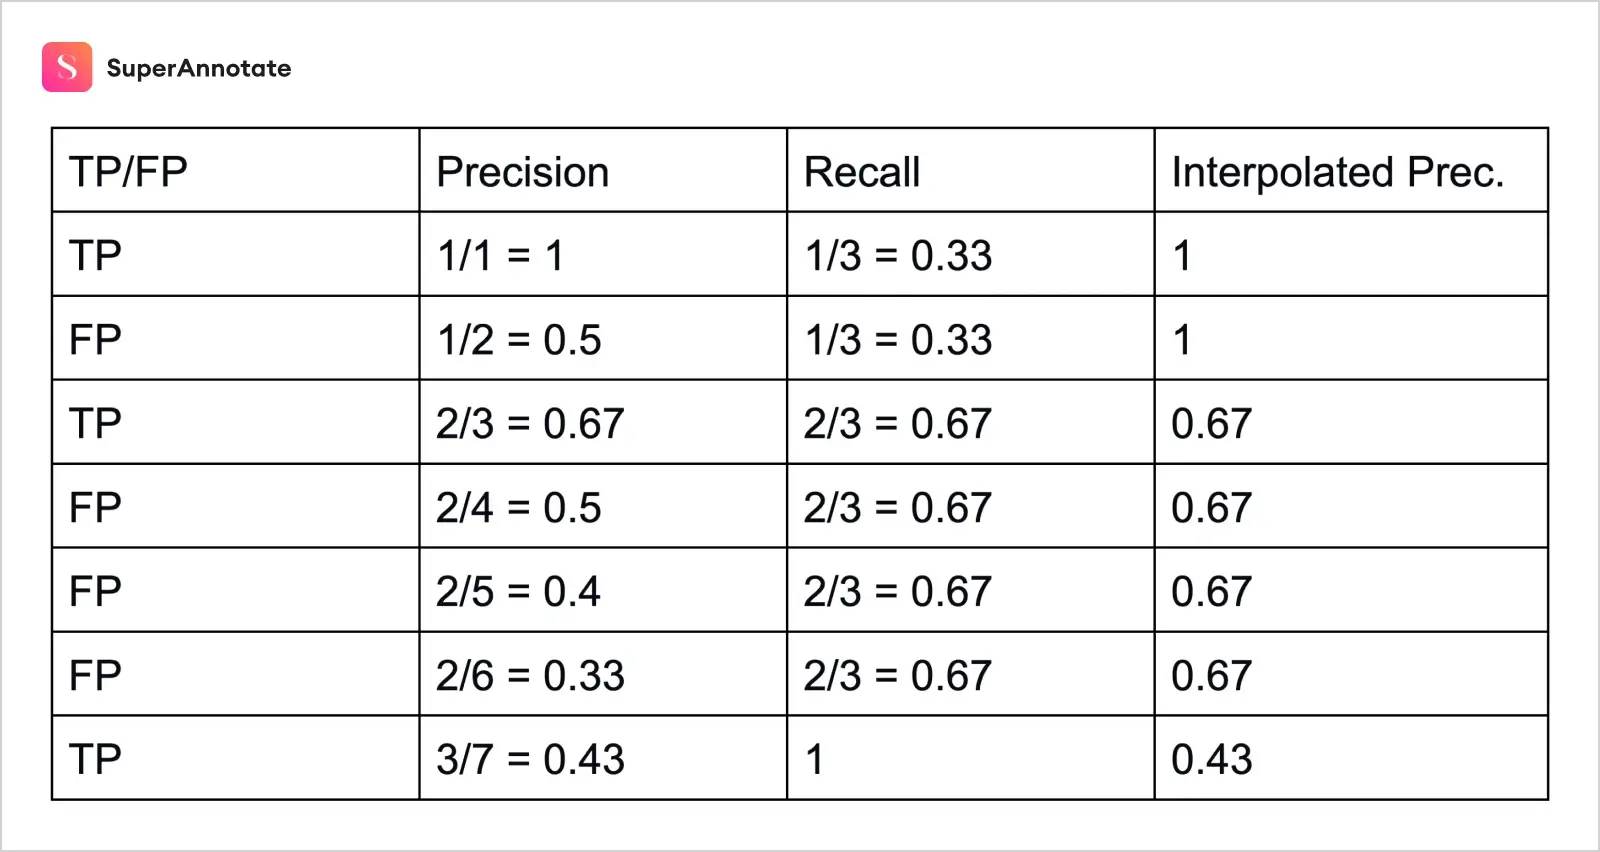
In the table, our first column demonstrates true or false positive values, the second and third columns represent precision and recall respectively, and we will explain the last column in a few minutes.
Note that the order is based on the confidence index of each detection case. Let's take a random row, say 4th one, and see how precision and recall are calculated.
Precision = Proportion of TP among TP and FP, and since at 4th row there are 2 positive cases out of 4, we'll have 2/4 = 0.5
Recall = Proportion of TP among all positive cases, which is 2/3 = 0.67
Each consecutive row is calculated in the same way, but what about our last column?
Let's plot the precision recall curve without the interpolation step.
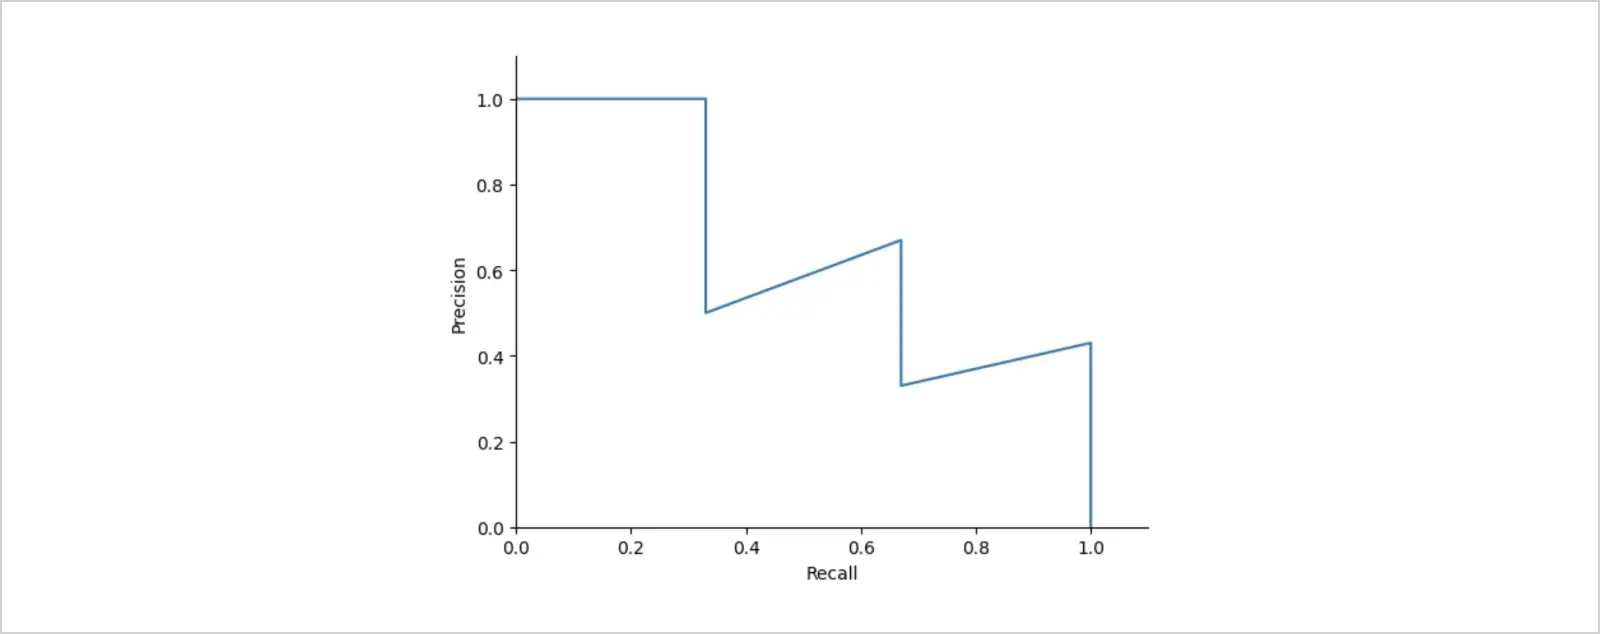
See the zig-zag, "wiggly" patterns? They show that the average precision value is sensitive to variations in the ranking, and the interpolation is here to address that issue. The last column of our table, "Interpolated precision", takes the maximum precision value at each recall level.

In the formula, r stand for recall, p(r)˜ stands for precision at recall level r˜, and p interpolated, as we already mentioned, is the maximum value of precision at every recall level
What we'll do is we'll replace precision values with interpolated precision scores instead, and observe the change on the same plot.
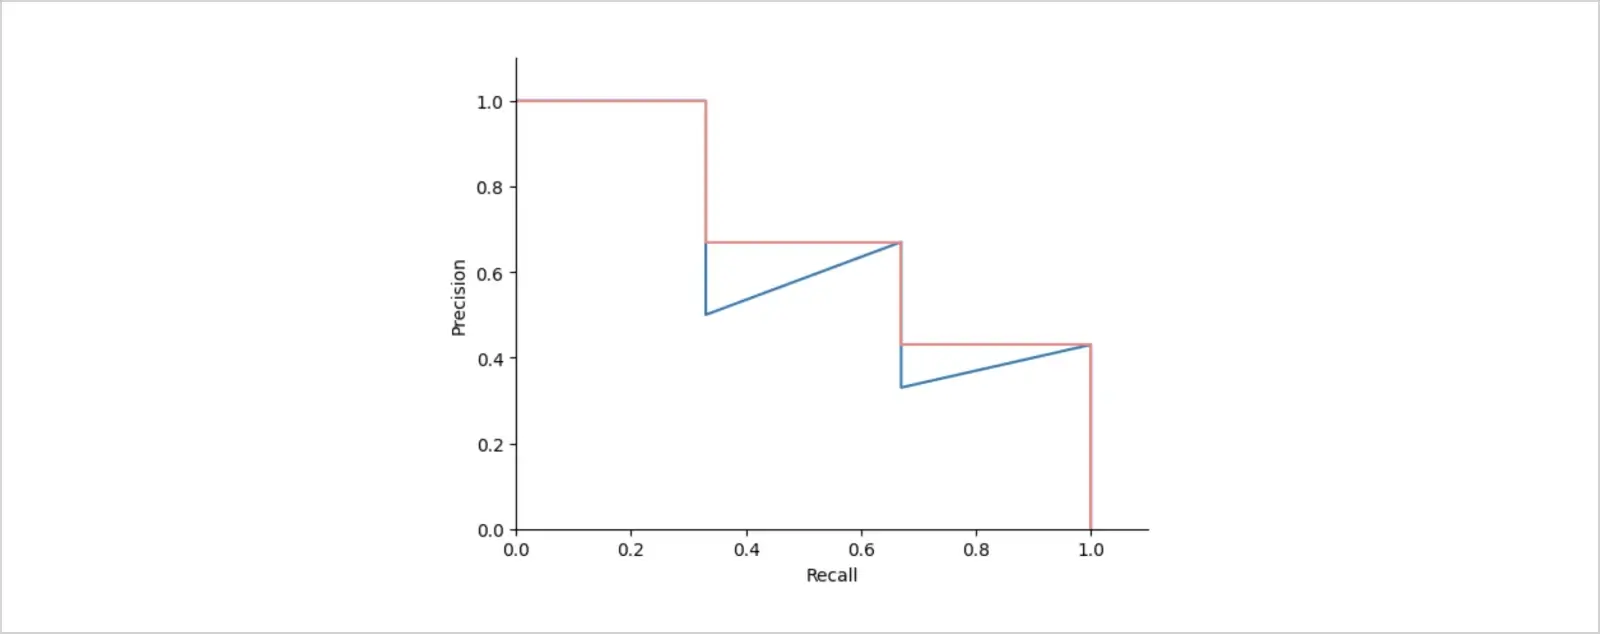
It's already vivid from this precision recall curve how interpolation smoothed the wiggles, and for the decrease in PR, the curve became monotonic instead of thundery.
Interpolated precision, finally, is calculated by dividing the recall range [0, 1] into 11 levels 0, 0.1, 0.2, ..., 1.0, and then calculating the average of maximum precisions at these recall levels.

In our example, AP = (1 + 1 + 1 + 1 + 0.67 + 0.67 + 0.67 + 0.43 + 0.43 + 0.43 + 0.43) / 11 = 0.7
The average precision value is high if precision and recall are both high and low when one or both of them lie below the model's confidence score threshold.
Calculating mAP from average precision
Let's put all the puzzles together and understand why even went through trues and falses, positives and negatives, IoU, precisions, and recalls. We now know all terms that come together to form and explain mean average precision.
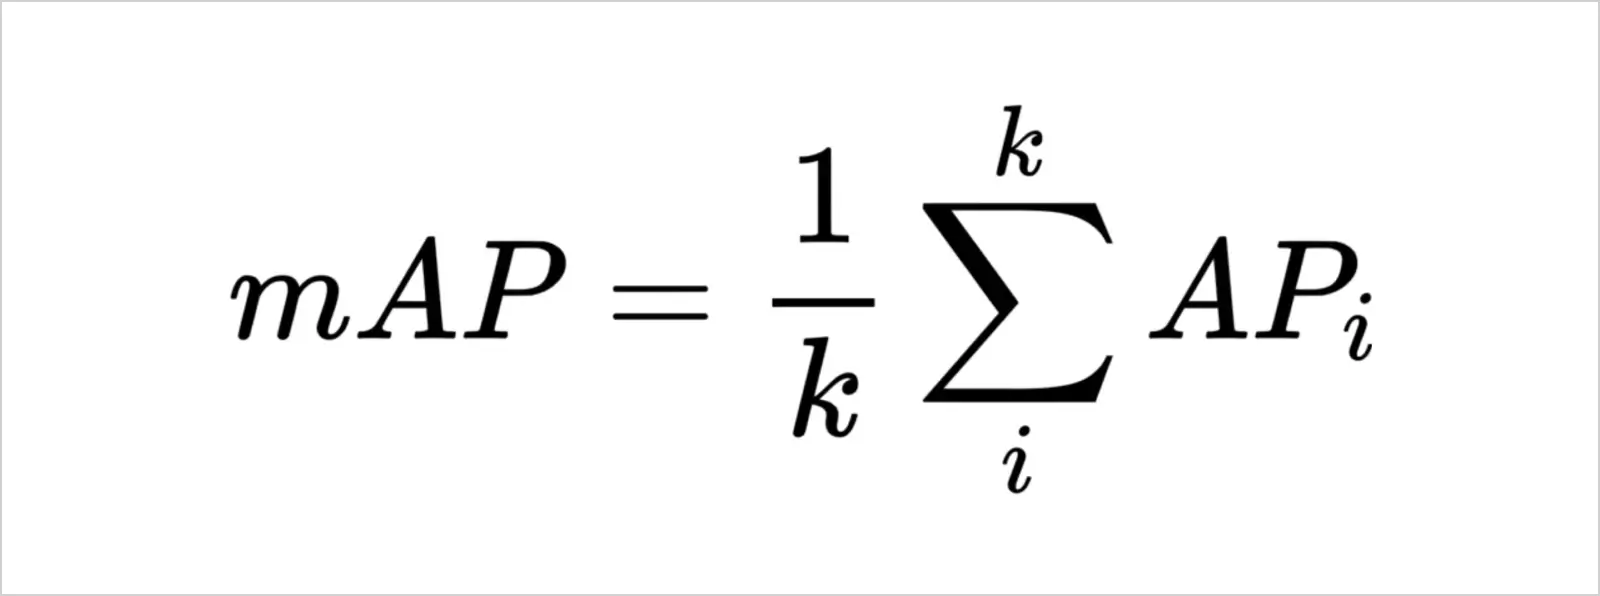
To make sure we haven't flown too far from our main topic, let us remember once again what mAP is; Mean average precision is a metric used to evaluate object detection models. If we talk mathematically, mAP is simple as that -- it's the mean of the average precisions that we were just discussing.
For our example, we considered only dog pictures. Now imagine there are many classes -- dogs, cats, horses, pigs... In real life, many object detection algorithms do deal with multiclass cases, where you need to calculate the Average Precision score for each class separately.
Mean average precision is the mean of APs calculated for all the classes.
It is very important to remember about intersection over union metric: given different IoU thresholds, your object detection model will classify TPs and FPs differently. Let's recall: Predicted bounding boxes are classified as true positives (TP) if their IoU with a ground truth box exceeds the threshold. With IoU below the threshold, predicted BBs are considered false positives (FP). Thus, further calculations of AP and mAP will be based on IoU threshold choice.
Evaluating object detectors: So, what's a good mAP score?
We've reached a point in the article where the reader may be thinking, “I get how mAP works and why we use it, but how do I actually interpret an mAP score?” Well, one way to look at it is the closer your model's mAP score is to 1 (or 100), the better. However, since a mean average precision score of 1 would mean that your model has perfect precision and recall across all classes with all IoU thresholds considered, it obviously isn't feasible. A more realistic way to evaluate a model, especially if you're using an open-source dataset, would be to take a look at the state-of-the-art. There are a bunch of different object detection challenges, the most famous one being the COCO challenge. The current state of the art has an mAP of 63.3, with only a handful of papers having achieved a mean average precision of over 60. This gives us some much-needed perspective on what expectations we may have from a robust object detection model. However, these numbers, of course, depend highly on the dataset in question, the number of classes, and a myriad of other factors.
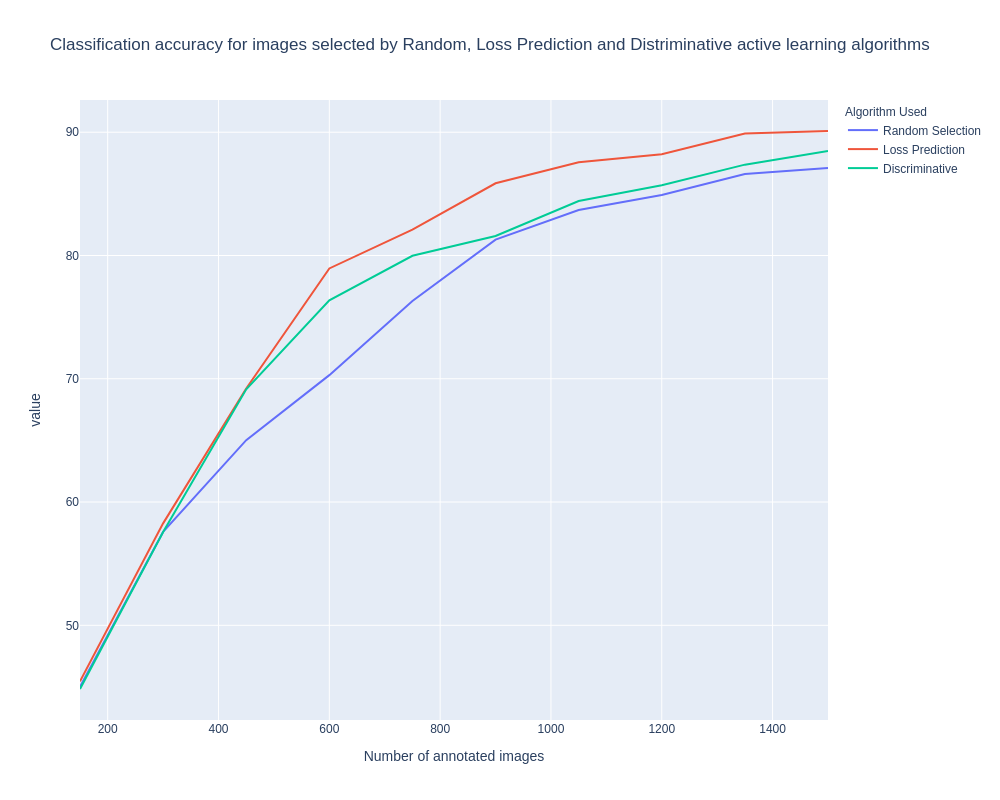
Jonathan Hui's article does a great job of comparing different object detectors' performances. He basically uses individual scholarly papers and summarizes their results through tables and graphs, and we'll take a closer look at one of the comparisons.
The following findings are based on a model that was trained using both PASCAL VOC 2007 and 2012 datasets. The mean Average Precision (mAP) was evaluated using the PASCAL VOC 2012 testing set. The results are displayed in the chart for two different input image sizes: 300 × 300 and 512 × 512 for SSD. For YOLO, the results are for 288 × 288, 416 ×461, and 544 × 544 images. It is observed that using higher-resolution images with the same model leads to improved mAP scores. However, the processing time is slower.
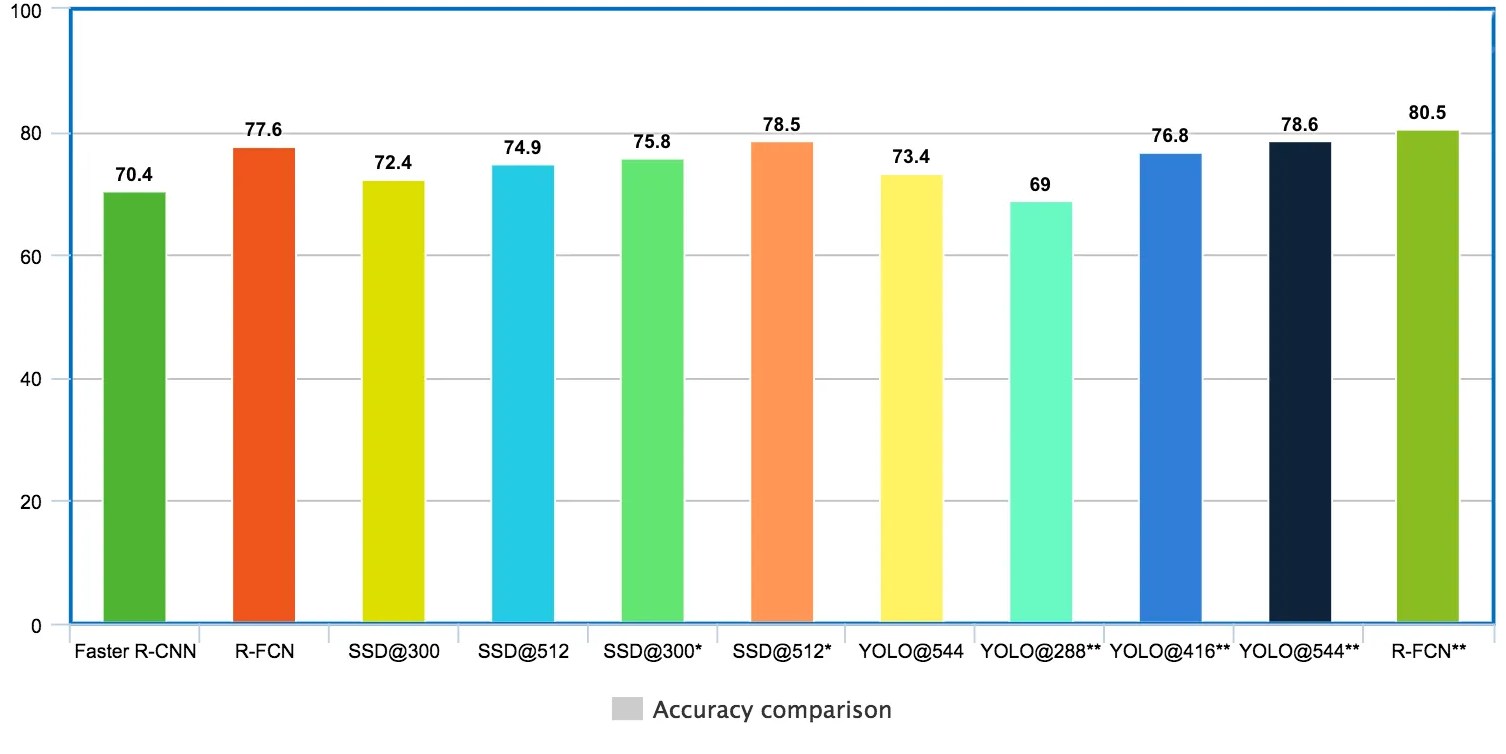
* denotes small object data augmentation is applied.
** indicates the results are measured on VOC 2007 testing set. We include those because the YOLO paper misses many VOC 2012 testing results. Since VOC 2007 results, in general, performs better than 2012, we add the R-FCN VOC 2007 result as a cross-reference.
Note that this performance comparison is taken from different papers and the experiments are done under different conditions; this implies that we shouldn't make a like-for-like comparison between the detectors. The graph aims to give you an overall idea of mAP metrics between various datasets.
For a fuller picture, we recommend you go through the rest of the article too.
And here's a short video snippet demonstrating YoloV2, Yolo 9000, SSD Mobilenet, and Faster RCNN NasNet in action.
Side note: On the interchangeability of Average Precision and mean Average Precision
This blog post talks about Average Precision and mean Average Precision as two separate concepts, which is how they're mostly talked about in the community and literature. However, the two terms are sometimes used interchangeably to refer to the idea behind mean Average Precision. For instance, the very same COCO challenge uses the term Average Precision when they are, in fact, talking about mean Average Precision. While this isn't very common, it's nevertheless useful to be aware of to avoid confusion.
Bonus: Why mAP can't be used directly
This blog post talked at length about how mean average precision is a good way to evaluate the performance of object detection algorithms. This might give the reader the wrong idea that mAP can be used directly in the training of neural networks. After all, what are loss functions if not a signal that tells the model how good it's doing? However, mAP cannot be used directly but is instead for humans to evaluate the performance of networks. Its intention is quite simple: the way we calculate mAP isn't differentiable. This is a deal-breaker since the optimization of neural networks relies heavily on differentiation.
To recap
As we discussed, mean Average Precision is an evaluation metric often used in object detection tasks as it provides a meaningful estimation of how good the neural network in question is doing. To compute mAP, we need to calculate precision and recall for each class for different IoU thresholds, plot them against each other, compute average precisions, and then mAP itself by taking the APs of all classes (one of the ways to calculate mAP). While an mAP of 1 (or 100) is theoretically possible, no model has been able to achieve a score even close to it yet, at least no major, publicly available datasets.