


Object detection is one of the most widely used algorithms in computer vision that assists in the classification and localization of target objects. While researching object detection, you will likely encounter terms such as AP (Average Precision), mAP (Mean Average Precision), and IoU (Intersection over Union), all of which are object detection metrics that help build better-performing models. IoU is a common choice among state-of-the-art object detection tasks, which we will focus on today.
In this article, we will look through the following:
- What is IoU
- Understanding IoU
- How does IoU work
- Where to get ground-truth data
- IoU in practice
- Alternatives to IoU
- Closing remarks
What is Intersection over Union (IoU)
Intersection over Union (IoU) is a measure that shows how well the prediction bounding box aligns with the ground truth box. It's one of the main metrics for evaluating the accuracy of object detection algorithms and helps distinguish between "correct detection" and "incorrect detection". By measuring how well the model's prediction describes the actual region of interest, the IoU score, alongside other evaluation measures, helps researchers gauge the effectiveness and reliability of their models and make informed decisions about algorithm performance.
Understanding IoU
Intersection over union is actually a very straightforward and self-explanatory measurement and is based on the Jaccard index (a coefficient for similarity for two sets of data). Given the two bounding boxes -- the predicted and ground truth ones and their areas, calculating IoU becomes a piece of cake.
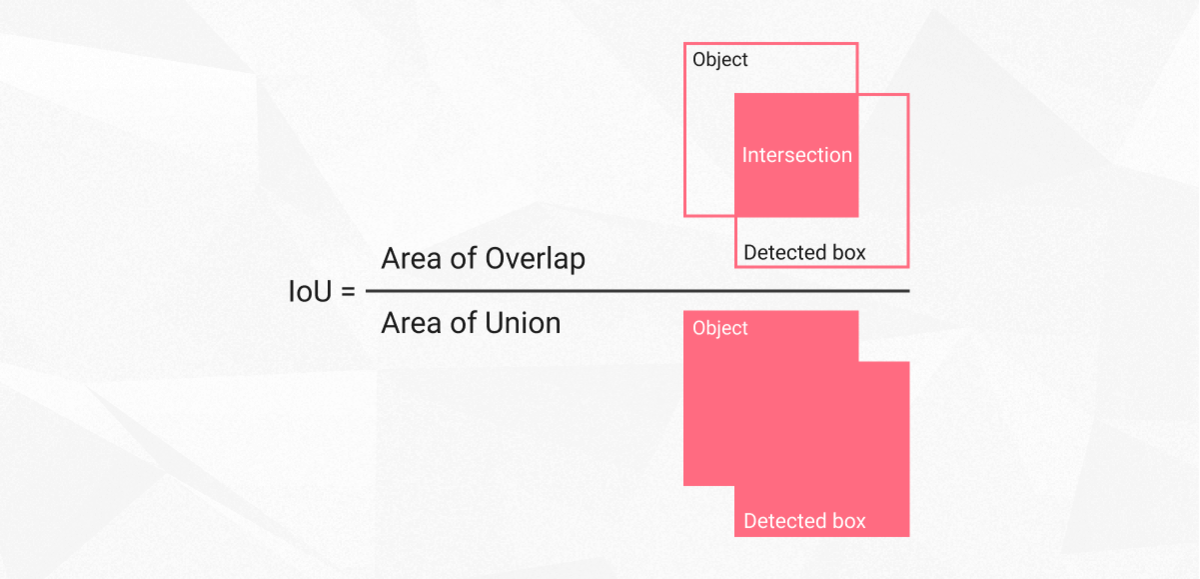
It may appear at first that IoU is an indicator of how tight the bounding box is, which, as much as we hate to break it to you, is not quite the truth. What the IoU shows instead is how tight the predicted bounding boxes are to the baseline, i.e., the ground truth. Now, what Intersection over Union (IoU) does is it calculates the overlap of the two bounding boxes divided by their union to provide an accuracy metric. To calculate IoU, we need the area of intersection and the area of union, where the formula of IoU will simply be:
IoU = Area of intersection / Area of union
IoU calculation
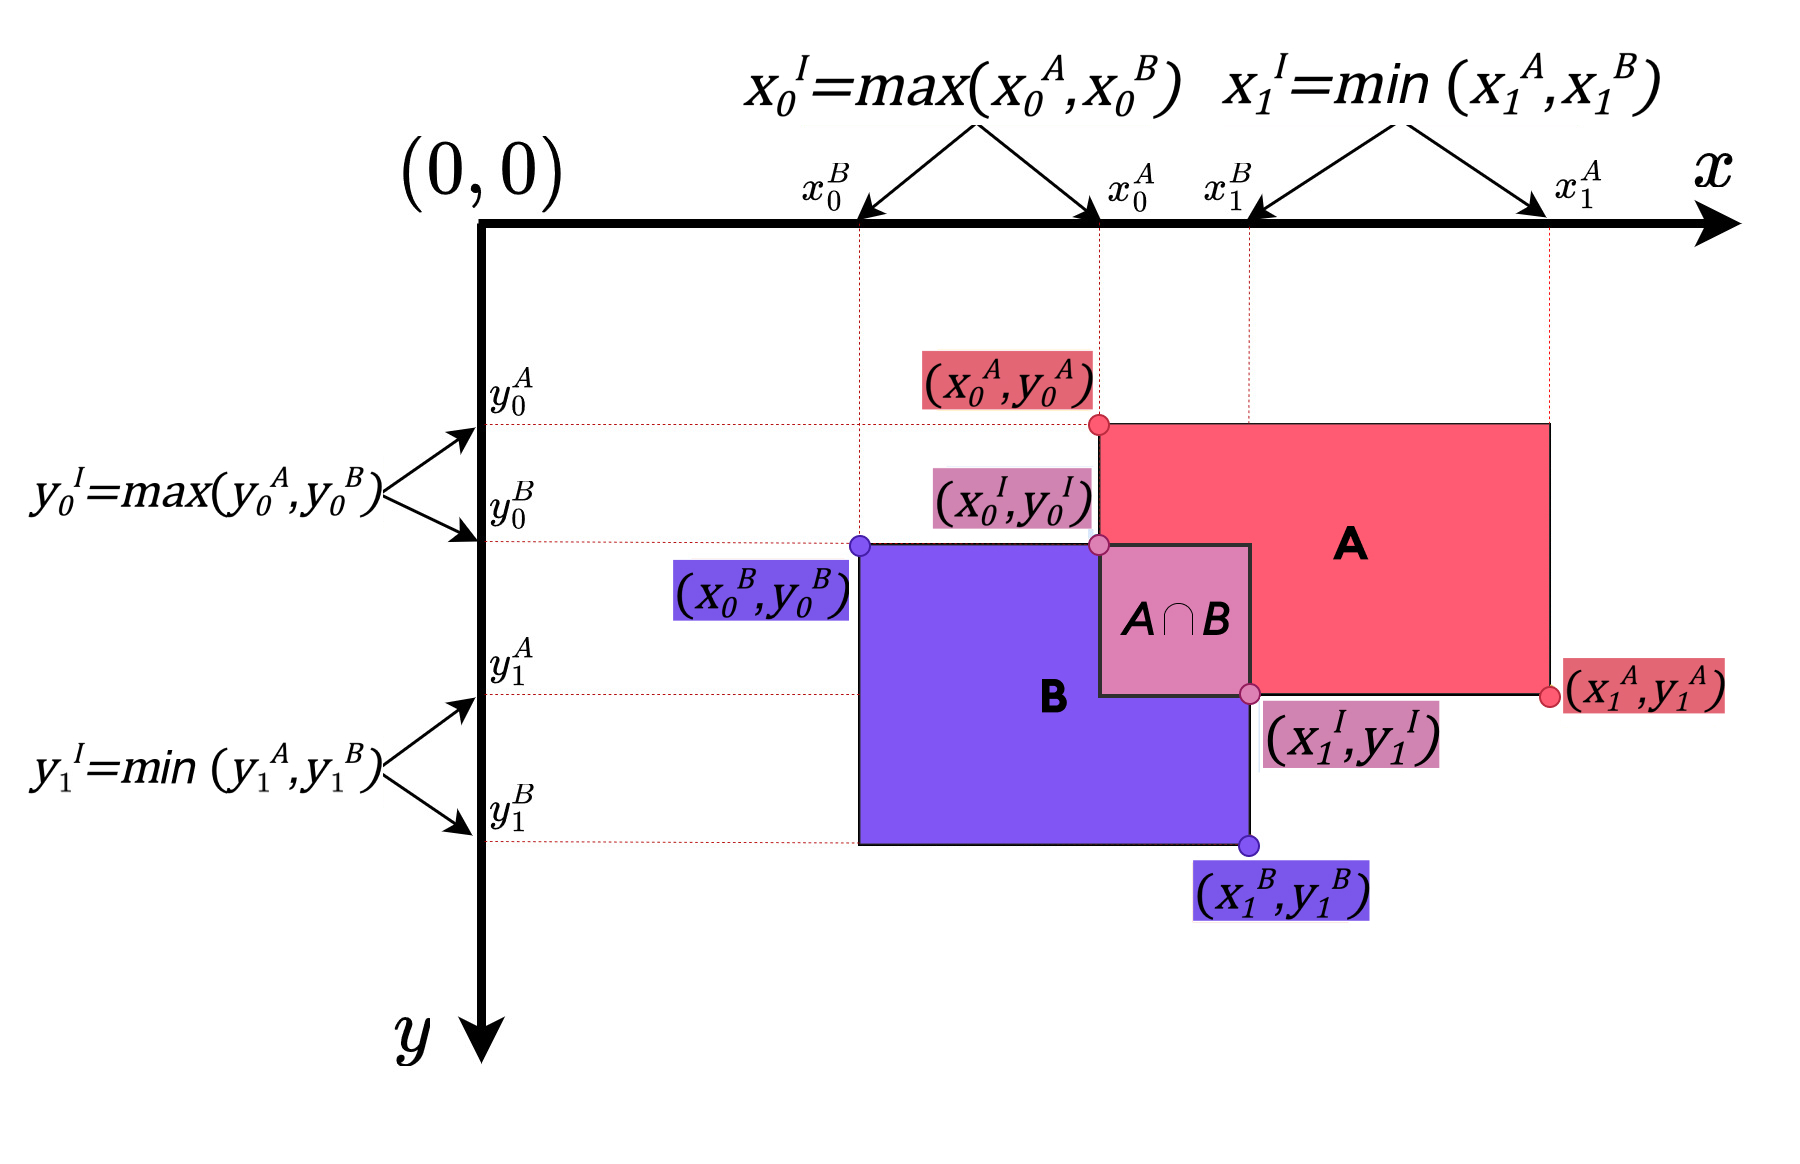
Now let's geometrically understand the intersection over union area calculation. Here are the calculation steps broken down:
To calculate the IoU, we need the coordinates of the bounding boxes or regions of interest in terms of their x and y coordinates. Let's consider two bounding boxes, Box A and Box B(order does not matter).
The coordinates of Box A are defined as follows:
- Top-left corner: (x0A, y0A)
- Bottom-right corner: (x1A, y1A)
Similarly, the coordinates of Box B are defined as:
- Top-left corner: (x0B, y0B)
- Bottom-right corner: (x1B, y1B)
To calculate the IoU, we follow these steps:
1. Determine the coordinates of the intersection area rectangle A ⋂ B:
- Leftmost x-coordinate of the intersection: max(x0A, x0B)
- Topmost y-coordinate of the intersection: max(y0A, y0B)
- Rightmost x-coordinate of the intersection: min(x1A, x1B)
- Bottommost y-coordinate of the intersection: min(y1A, y1B)
2. Calculate the area of the intersection rectangle A ⋃ B:
This is just the multiplication of the bounding box's width and height.
- Intersection area = (rightmost x - leftmost x) * (bottommost y - topmost y)
(Note: If the intersection area is negative, it means there is no overlap between the boxes, and the IoU is 0.)
3. Calculate the area of Box A and Box B:
- Area of Box A = (x1A - x0A) * (y1A - y0A)
- Area of Box B = (x1B - x0B) * (y1B - y0B)
4. Calculate the Union area:
- Union area = Area of Box A + Area of Box B - Intersection area
5. Finally, compute the IoU:
- IoU = Intersection area / Union area
1) Intersection area I
2) Union area U
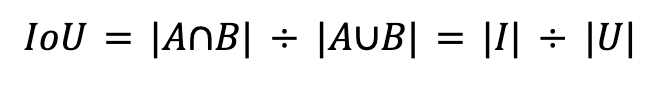
Here's a more neat formula for IoU( A and B are ground truth and predicted bounding boxes).
The IoU value ranges from 0 to 1, where 0 indicates no overlap between the boxes, and 1 represents complete overlap or identical regions. Higher IoU values indicate greater similarity or agreement between the two bounding boxes.
We usually decide a threshold t for IoU, and according to the threshold, if IoU is bigger than t, then the detection is considered correct, otherwise -- incorrect. While IoU value of 1 indicates a perfect alignment between the predicted and ground truth bounding boxes, however, this case is extremely uncommon in practical object detection tasks. IoU value of 0, as you might guess, means 0 overlap between the two boxes. Let's see how IoU works in practice.
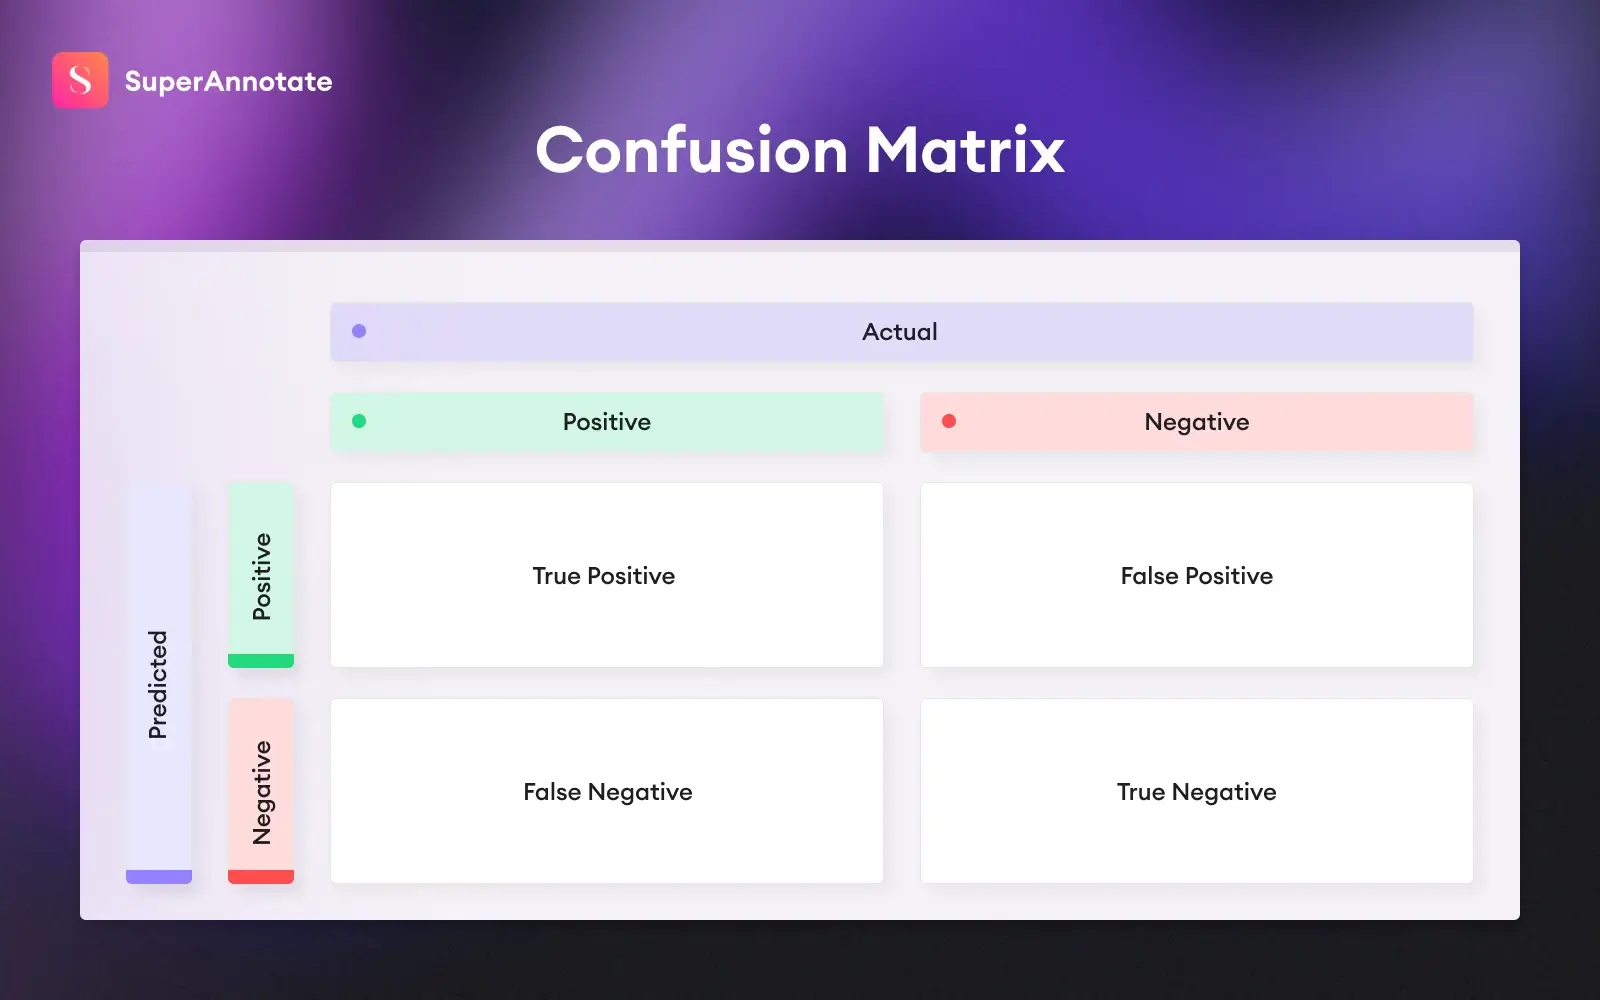
Confusion matrix
To understand the IoU concept more comprehensively, we should recall some fundamental object detection evaluation metrics. We touched upon them in detail in our article on mean average precision; i.e., true positives, false positives, and false negatives.
In the case of object detection, they are interpreted as follows:
True positive: the model has identified the correct type of object in the correct location
False positive: the model has identified an object that isn't there or has assigned a wrong label
False negative: the model hasn't identified an object that it should have
We'll use these concepts along with IoU to make decisions on whether or not our detections are correct based on examples.
How does IoU work?
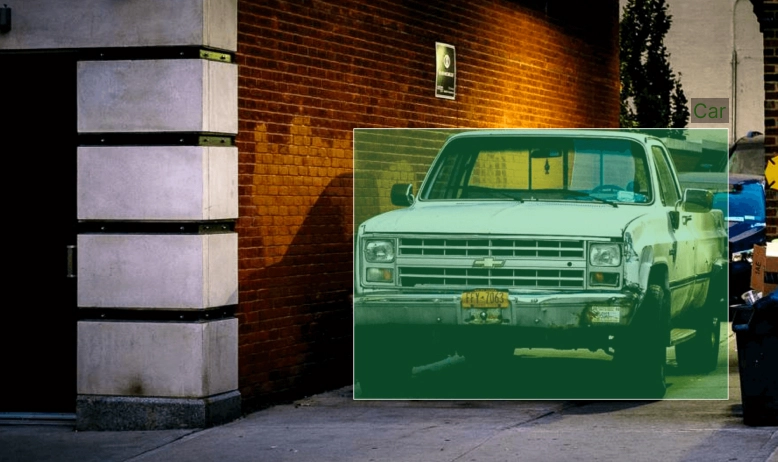
Suppose you're working on a car detection problem, and the ground-truth bounding box looks like the one below:
1. Let us now discuss different scenarios of how the model could detect the car:
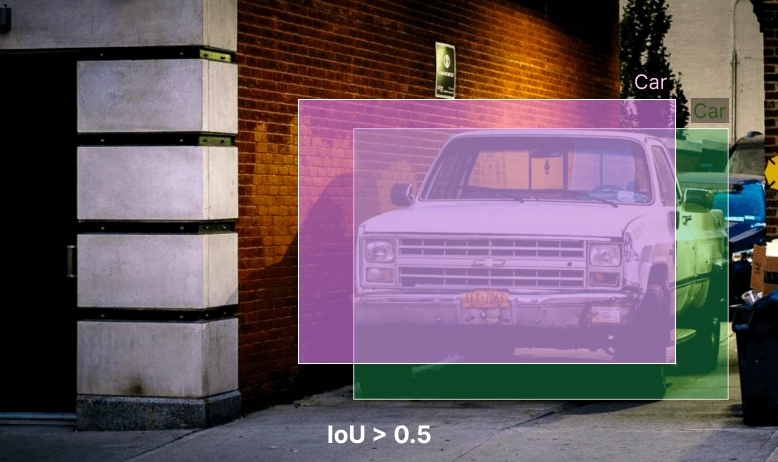
In case of the first prediction, the predicted bounding box lies pretty close to the ground truth bounding box. With the intersection over union score higher than 0.5, we have a correct detection.
Conclusion: true positive detection
2. Let's discuss two other cases:
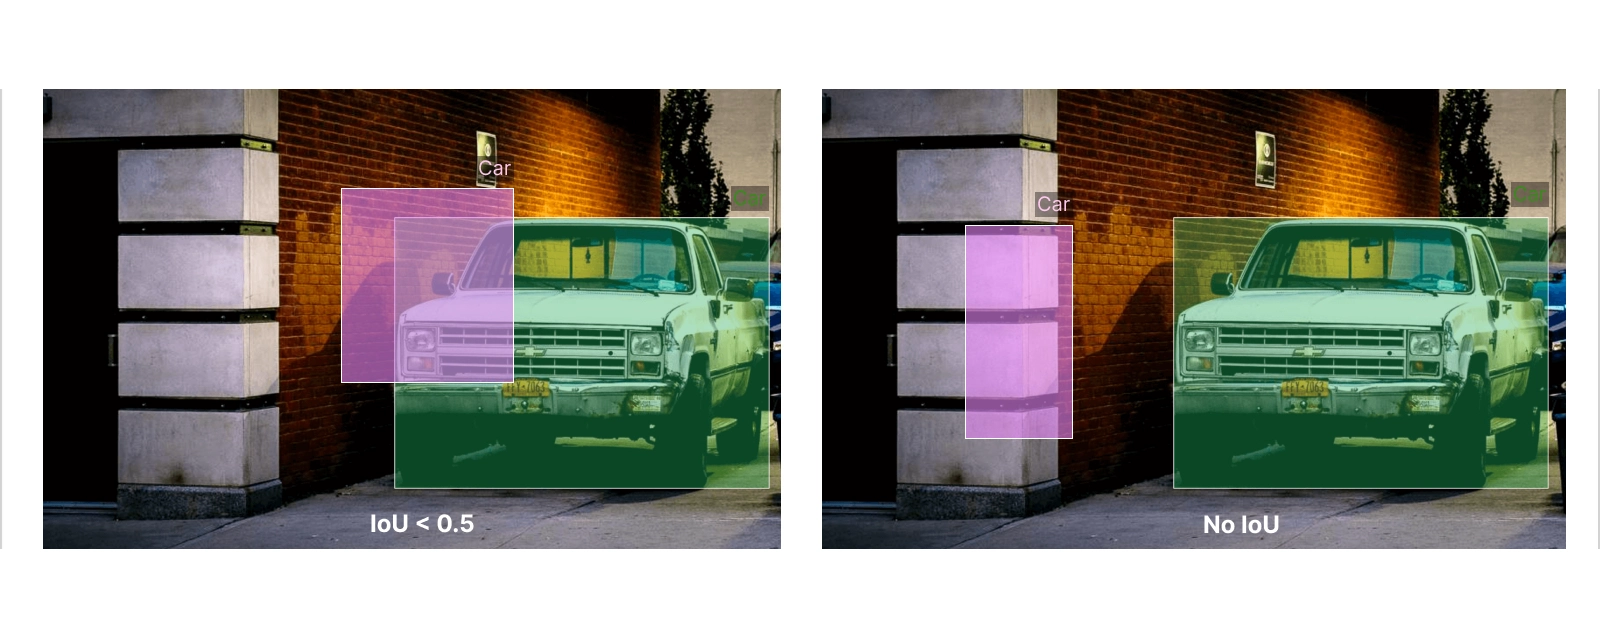
Do these cases look like good predictions to you? In the first image, we observe that our prediction captures only a small part of the true car region, and the IoU metric has a value of --, which leads us to conclude a false positive case. In the second detection, it has no intersection at all with the ground truth bounding box, having a 0 value for IoU. Both of these are false detections.
Conclusion: false positive detection
Let's move to the last example:
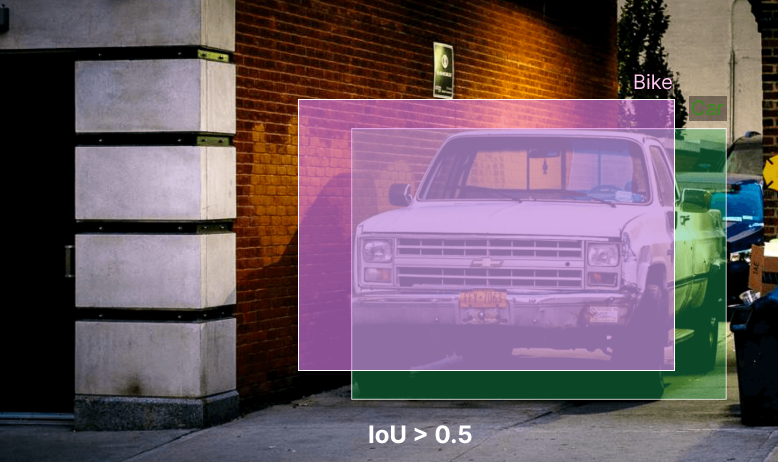
At first, we notice a pretty good match between predicted and ground truth bounding boxes. The problem here is that our predicted label is "bike" instead of "car", a mistakenly identified false value, in more practical terms -- false negative.
Conclusion: false negative detection
Bottom line—pattern recognition is not as easy. The probability that your bounding box coordinates will match exactly the same is about nonexistent, but we'll get back to that in a minute.
Where to get ground-truth data
Ideally, if you are at the model evaluation stage, you've got data collection covered. To train an object detection model, you, first off, need a pre-labeled dataset, which, in turn, has to be divided into the following subsets:
- Training set: the first batch of data fed into the model.
- Testing set: used for evaluating the model accuracy.
- Validation set (optional): used to tune hyperparameters.
The sets above are constituents of the actual data, annotated with boxes, i.e. (x,y coordinates of the object in an image).
Note: 0.5 IoU is typically considered a “good” score, while 1 is perfect in theory.
You can get ground-truth data in several ways:
1) Collect manually
3) Generate your own synthetic dataset
No matter where you get the ground-truth data or how carefully you label, it's extremely unlikely to have the predicted output match the ground-truth bounding box coordinates. That is because the parameters, such as image pyramid scale, sliding window size, etc., exclude the possibility of a heavy overlap, which explains the theoretical applications of score 1.
IoU in practice
To train a custom object detector to spot the presence of a given object in images, we'll use Python.
Assume we have two bounding boxes, the ground truth and predicted ones. We assign the coordinates for the intersected area, and compute the area of intersection rectangle and the two bounding boxes. We then compute the IoU metric with the formula we learned.
Overall, this code snippet provides a function that can be used to calculate the IoU between two bounding boxes, given their coordinate information.
Let's break down the code into parts and explain:
The code starts by performing assertions to validate that the coordinates of the bounding boxes are in the correct order. It ensures that x1 is less than x2 and y1 is less than y2 for both bb1 and bb2. These assertions help ensure that the bounding box coordinates are valid.
Next, the code determines the coordinates of the intersection rectangle by finding the rightmost x-coordinate (x_right), the topmost y-coordinate (y_top), the leftmost x-coordinate (x_left), and the bottommost y-coordinate (y_bottom) based on the input bounding boxes.
If the intersection rectangle has a non-positive area (i.e., x_left is less than x_right or y_bottom is less than y_top), it means the bounding boxes do not intersect, and the function returns an IoU of 0.0.
If the bounding boxes do intersect, the code calculates the area of the intersection rectangle (intersection_area).
Then, it calculates the areas of bb1 and bb2 by multiplying the differences between their x-coordinates and y-coordinates.
Finally, the code computes the IoU by dividing the intersection_area by the sum of the areas of bb1 and bb2 minus the intersection_area. It ensures that the IoU is within the range of 0.0 to 1.0 and returns the computed IoU value.
Generalized intersection over union (GIoU)
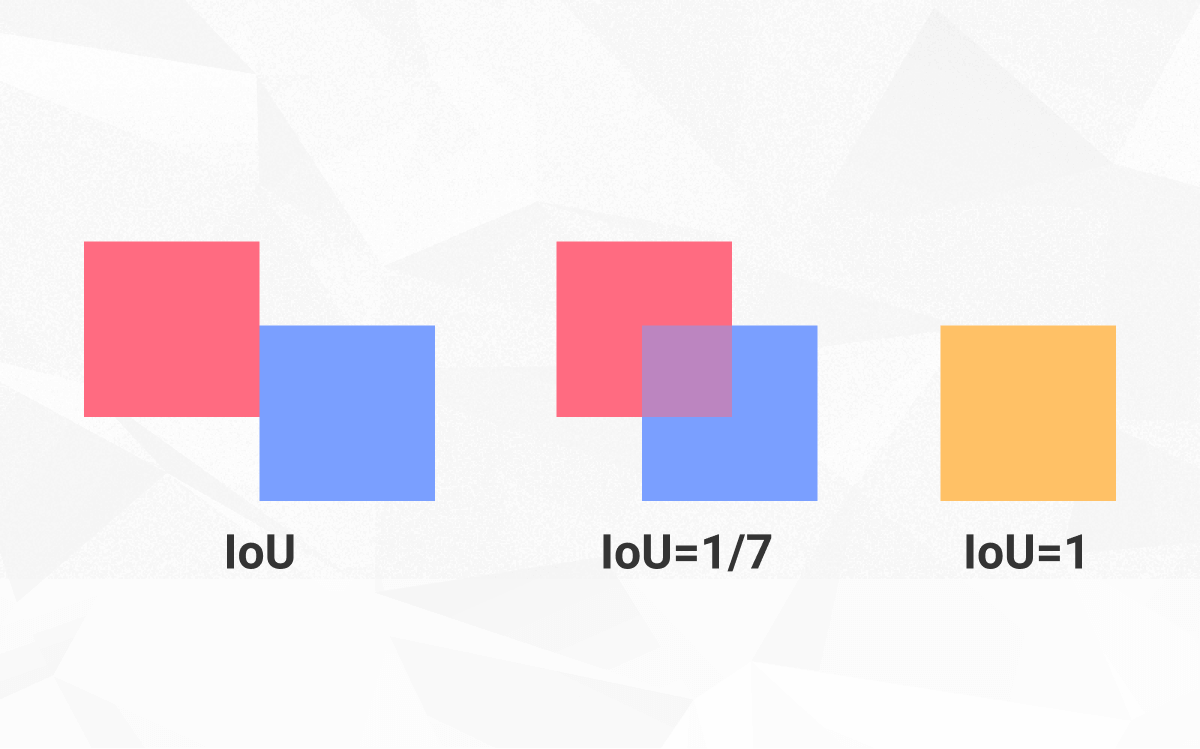
Let's recall the second image of our false positive case, where the predicted bounding box had no intersection with the ground truth bounding box, and the intersection over union score was 0. The drawback of traditional IoU is that this 0 score does not give any information on the prediction quality. This means whether our model's predicted bounding box lies kilometers away from the ground truth bounding box or just beside it, IoU will not differentiate the two cases. In other words, IoU falls short in distinguishing between different levels of closeness to the ground truth.
This is where generalized intersection over union (GIoU) comes into play. GIoU takes into account not only the intersection between the predicted and ground truth boxes but also the enclosing area that encompasses both boxes. By considering the enclosing area, GIoU provides a more informative evaluation of the prediction's proximity to the ground truth, even in cases of no intersection. This enables a better understanding of the quality of predictions and allows for more nuanced comparisons between different bounding box predictions.
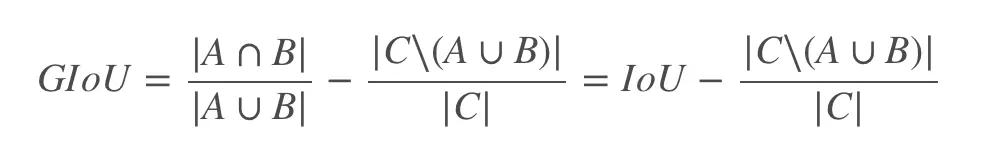
- Where A and B are ground truth and predicted bounding boxes, and C is the area of the enclosing box(the area of the smallest bounding box that encloses both the predicted and ground truth bounding boxes)
Here's what you can remember about GIoU:
- It is more robust to misaligned bounding boxes than standard IoU.
- It can be used to measure the performance of object detection models that use different-sized bounding boxes.
- It is a differentiable metric, which means that it can be used with gradient-based optimization algorithms.
Alternatives to IoU
IoU is not the only metric for measuring the accuracy of object detectors. Average Precision (AP) or mean Average Precision (mAP) are common alternatives, both of which are used to evaluate models such as Faster RCNN, Mask RCNN, and YOLO. AP is calculated for every single class, meaning the number of classes and AP values should be equal.
The mAP then is the average of AP values of all classes together:
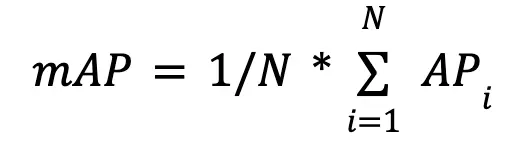
To better comprehend AP and mAP and analyze them in practice, we should define and draw the precision and recall curve first, which is an entirely separate article: For the time being, keep in mind that the two above are analogous object detection metrics you'll encounter more often.
Closing remarks
Any algorithm that outputs a bounding box can be evaluated using an IoU. We hope this article provided you with insights into IoU, as an object detector metric, by introducing calculation techniques, implementation, and alternative metrics. If you find this article helpful and would like to know more about various topics in computer vision and machine learning, leave your email below.